The world is a huge, constantly changing system that is as unpredictable as it is beautiful. Through advanced scientific technology we can record information about our planet in near real-time.
The world watched as the catastrophic Hurricane Harvey struck, causing unprecedented damage in Texas and surrounding states and countries.
During the disaster, we also saw the sheer amount of data collected, managed and presented in real time. Geographic Information System (GIS) technology was instrumental in sharing multidimensional data, helping recovery crews. You can see an example of this in the Hurricane Harvey Open Data site created using Esri’s ArcGIS platform.
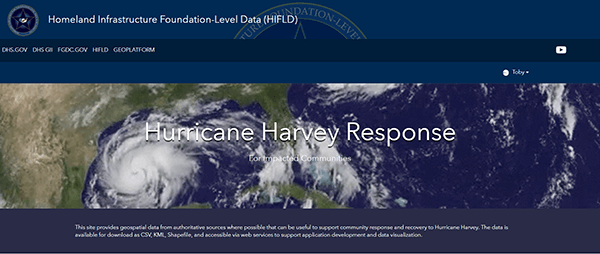
Constant environmental data from satellites, sensors, people and countless other sources gives us insights to the weather, land and ocean. The problem is now not how we collect environmental data, but rather how do we handle it and what do we do with it?
GIS technology can answer these questions.
Real-time environmental data is multidimensional, not only containing information about a location and time of an event but also other values such as the magnitude of an earthquake, air temperature, ocean current directions and strength.
This information is used to save lives and provide services for disaster response for events such as Hurricane Harvey, Cyclone Debbie or in uncontrolled bushfires.
Multidimensional data is used to support a whole host of other activities from analysing chlorophyll data and ocean currents to direct fishing activities, to using satellite imagery to support crop management.
ArcGIS contains tools that operate on multidimensional data in different formats and from multiple sources.
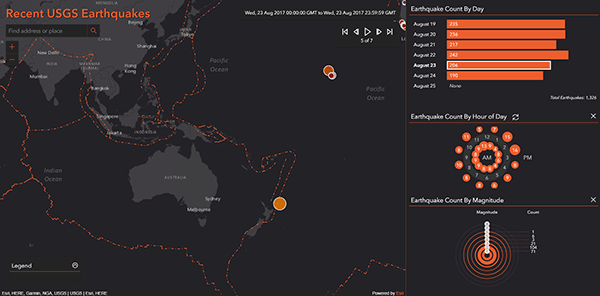
All spatial data has a time component, and when you work with temporal data in maps, you gain new insights. ArcGIS is specifically designed to take the time element into account. As a user of a map application you can move time sliders to choose layers and animate features. As an administrator, server technology allows you to filter and process data over time – perhaps you only want to display data in a certain area or you want to show a daily update rather than hourly.
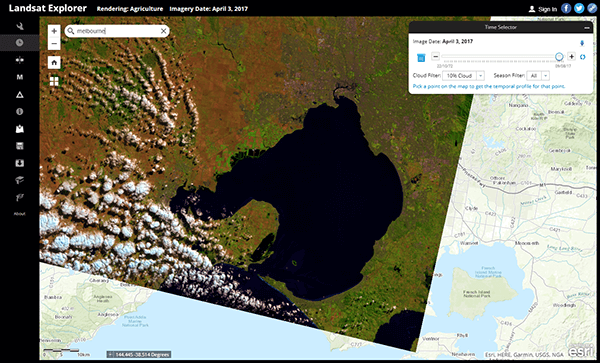
Multidimensional data is also by its nature Big Data. A single satellite image is often over one gigabyte and a satellite constellation will have billions of square kilometres of data in an imagery archive. So how can you handle this much data?
Big Data can be stored and shared using dedicated servers that enable fast processing times (what once would have taken weeks or days can now takes hours or minutes). You can also take advantage of cloud capabilities, storing data offsite, enabling fast access to the information you need when you need it, without putting pressure on your own network. Using products such as ArcGIS Image Server, you can store and handle vast amounts of data.
Check out the example of Esri’s Landsat Explorer app which uses Amazon Web Services; you can explore and analyse the Landsat archive using time sliders to choose image layers.
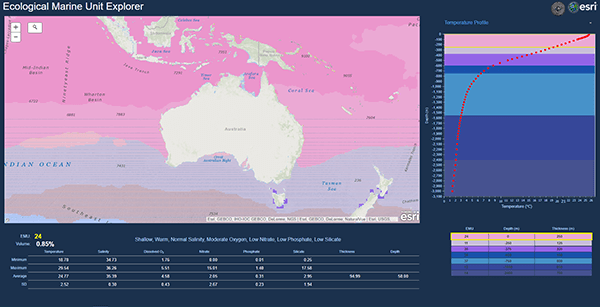
Complexity is a key issue of multidimensional data. Scientific data contains multiple values that can be too much to handle in a map. ArcGIS technology lets you take advantage of maps and statistics in one environment to make complex data simple to work with.
To see this in action, take a look at the EMU Ecological Marine Unit Explorer web app. This application contains data from sources such as National Oceanic and Atmospheric Administration (NOAA) that shows 3D temperature and depth profiles of the ocean, with the chemical composition displayed in graphs and tables.
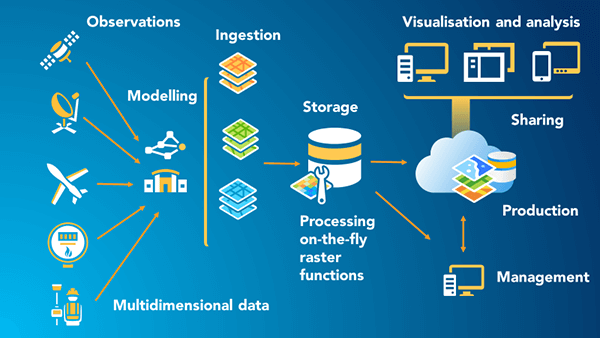
When working with multidimensional data it is likely you’ll be working with data from a variety of different providers. ArcGIS supports most scientific data formats such as NetCDF, GRIB and HDF, plus open data formats such as Web Map Services and Web Feature Services. It also has the capability to output open data formats or for users to clip out their own data.
Organisations globally working with multidimensional data need a platform that supports workflows from ingestion to storage, management, production, sharing, visualisation and analysis.
GIS will be used increasingly to display multidimensional data as more devices collect information about our environment.
Let’s see what the future brings!
To find out more about multidimensional data in ArcGIS, contact Esri Australia on 1800 870 750 or send us an email.

