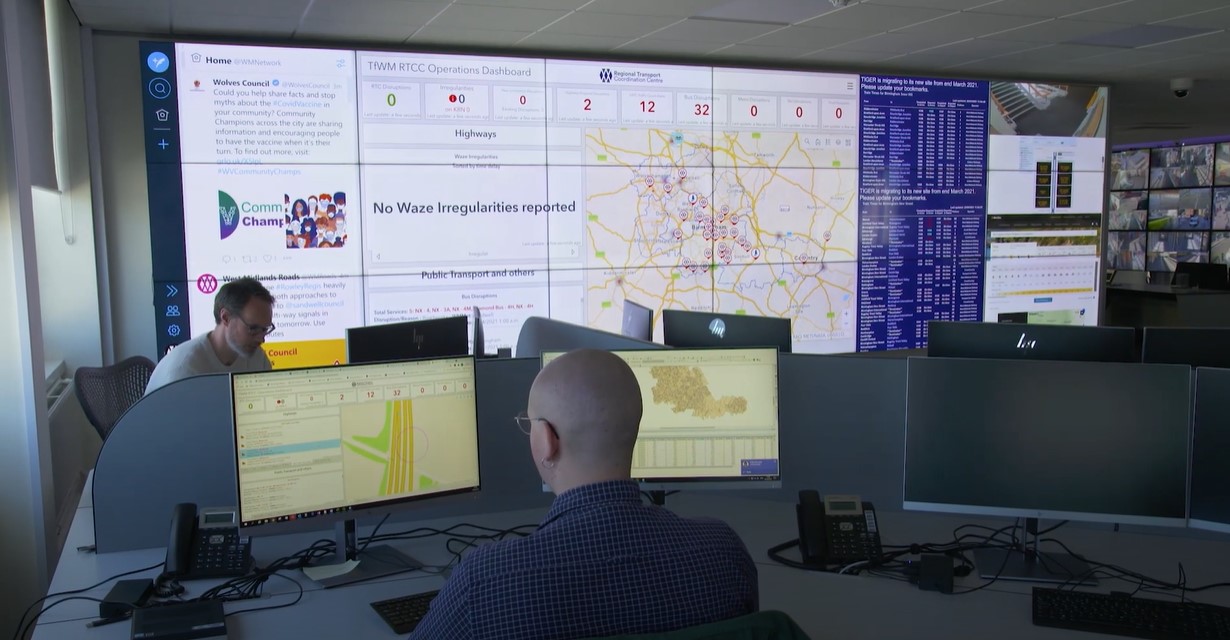
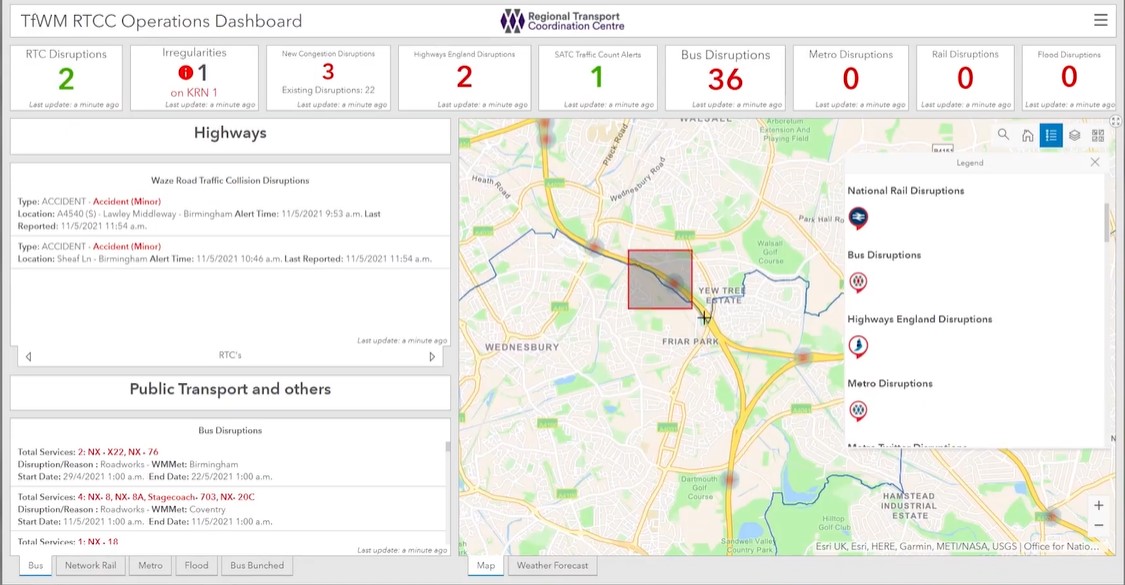
Transport for West Midlands has developed a state-of-the-art ArcGIS dashboard, combining live transport data with crowd-sourced information.
In the English metropolitan county of West Midlands, a booming economy and a rapidly growing population are placing unprecedented pressure on public transportation services and the local road network.
More than A$7 billion is currently being invested in the region on a range of road, tram, bus and rail network improvements, which are expected to alleviate this congestion in the future. In the meantime, construction traffic and building works for new rail stations and tram services are creating added disruption and exasperating the challenges.
Transport for West Midlands (TfWM) wanted to help local authorities, public transport operators, Highways England and the police to better manage planned and unplanned transportation network disruptions. It aimed to support growth in the local economy, by making it easier for people and goods to move around the area.
A holistic view of the entire transport network
TfWM used Esri’s ArcGIS Dashboards to bring together real-time transport data from local authorities, commercial rail, tram and bus operators, Network Rail and Highways England.
The organisation then used ArcGIS GeoEvent Server and FME Workbench to enhance and integrate this live data, as well as geocode railway stations and bus stops.
The Waze Live Alerts Layer in ArcGIS was used to incorporate crowd-sourced data about slow-moving traffic and disruption to tram services from Twitter.
According to Stuart Lester, Data Insights Manager at TfWM, “The development of the Esri solution was fast and agile. We had a trial version, incorporating crowd-sourced and third party data, up and running within just two months, which helped us to gain the buy-in and confidence of partners."
"Our dashboard gives us the real-time and analytical information we need to improve movement throughout the region and support economic growth, by enabling a proactive response to the causes of congestion."
The dashboard is used by local authorities, transport providers and emergency services, giving everyone the same comprehensive overview of the status of all transportation services and roads, across the entire region.
Locating value in transport data
By continuing to leverage the capabilities of ArcGIS, TfWM is now extending the functionality of its dashboard to enable it to generate automatic alerts about transport issues for the general public, using links to satellite navigation systems, radio and television channels, social media and subscription-based news services.
With instant access to live information, managers can react quickly to unplanned incidents to improve the travel experience for West Midland’s 2.8 million residents.
All of the live information presented in the dashboard is stored in ArcGIS, and a trial project is currently underway to analyse this data using ArcGIS Velocity, to gain insight into long term transport patterns and changes in commuter behaviour.
If a delivery vehicle obstructs road traffic, or a train service is delayed, all duty managers can instantly see the issue and anticipate the impact on other local roads and public transport.
The insight that TfWM will gain from analysing live traffic data will help to put effective plans in place for special events - including when Birmingham hosts the Commonwealth Games in 2022.
“It will enable us to manage the impact of millions of additional visitors to the region, ensuring they have a pleasant travel experience, while minimising disruption for the people who live and work in the West Midlands every day.”
A reliable transport infrastructure for economic growth
The dashboard will help TfWM to support the local economy by enabling it to reduce disruption from the significant number of infrastructure projects taking place in the region.
This information can be used to guide partners to re-phase traffic lights to alleviate congestion on a diversion route, or to notify commuters of public transport changes.
In particular, it aims to make journey times more predictable, so that commercial vehicles can deliver components to just-in-time manufacturing plants on schedule, and reduce the cost of congestion for the region’s businesses.
“Travel disruptions are inevitable, but we can now intervene quickly to alleviate the situation and provide people with good quality, timely information so that they can decide when and how to travel to make best use of their time," says Lester.
- Case study provided by Esri UK -