The availability of data, its accuracy and its representation, can have a fundamental impact on how governments, health care providers, businesses and the public respond to the global coronavirus pandemic.
The Australian Bureau of Statistics (ABS) is sharing complex data in an easy-to-use, digestible format for public consumption to assist government agencies and communities around Australia in understanding the potential impacts of COVID-19.
ABS Director of Geospatial Solutions, Martin Brady, speaks with Mathew Linnane about the new data sharing strategy that leverages advanced technologies to better present national datasets in a way that’s easy to understand.
Mathew Linnane: How is the new ABS data sharing strategy enabling informed decision-making regarding COVID-19 response efforts?
Martin Brady: The implications of the spread of the coronavirus are highly uncertain and in these circumstances, there are sizeable benefits for the community and governments to have access to information about the population and businesses that is as up-to-date as possible. The ABS is responding to this by producing a range of new statistical products to help us all understand what the impacts of this worldwide event may be.
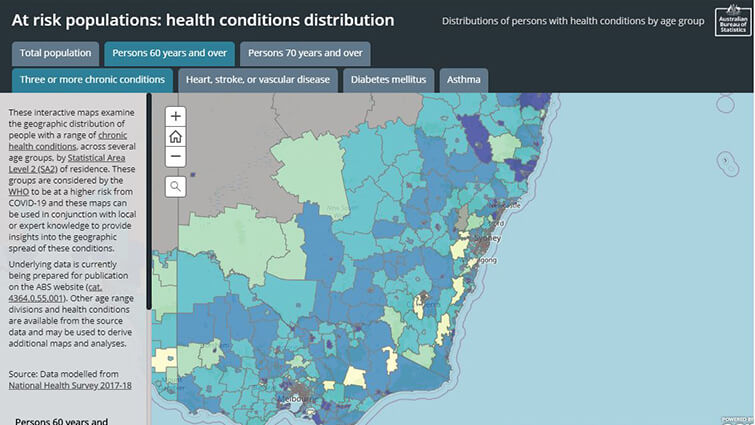
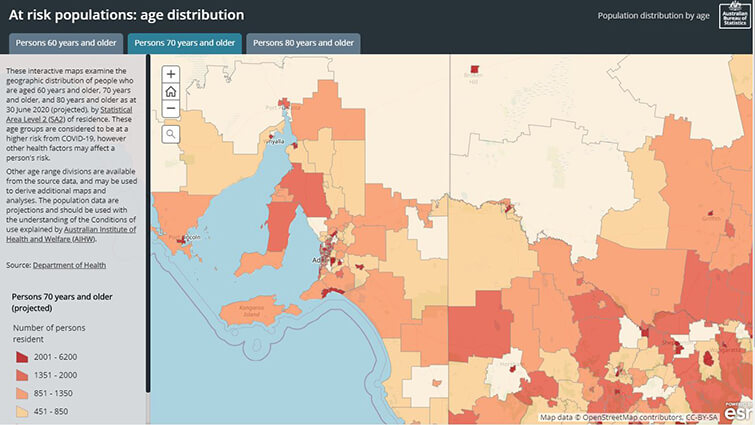
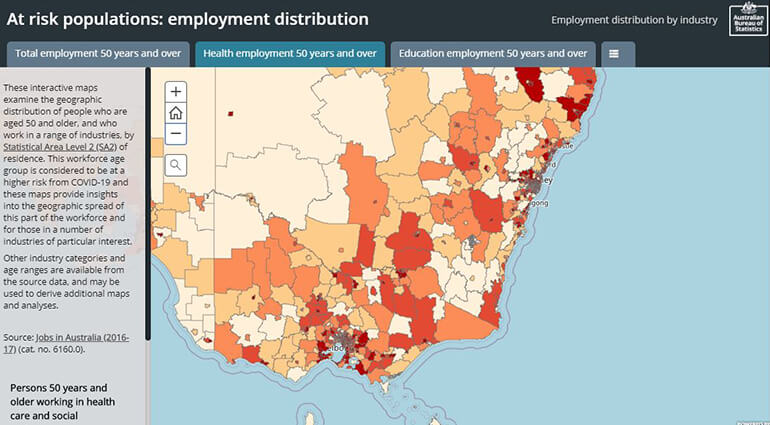
Mathew Linnane: What do these statistical products and maps highlight?
Martin Brady: We’ve known from the beginning that the coronavirus pandemic won’t affect all populations evenly. The maps highlight the at-risk populations, whether that’s by age distribution and chronic health conditions, or by employment. For example, the employment distribution map identifies areas where people aged 50 or older and are working in the health care and social assistance sector, education or hospitality.
Mathew Linnane: Can you give us examples of how these maps can be used in responding to the current crisis?
Martin Brady: Information like this can be used to inform the response efforts. For example, these populations may be at risk of losing their jobs and require income support or may have a higher risk of infection and so preventive action can be targeted accordingly. The at-risk populations by chronic health conditions are an indicator as to where there could be a higher risk of infection, and where close monitoring of infection could be focused.
Mathew Linnane: How can this data be used in potential disease control?
Martin Brady: Geography and location analysis have a crucial role in better understanding this evolving epidemic. The value of these maps is amplified when viewed with other data to give a more detailed picture of the situation at hand. For example, these maps could help develop a support network for the more vulnerable elderly populations or inform medical practitioners of the risks of infection in their communities. This kind of information could critically improve outcomes and save lives.
Access the Australian COVID-19 Hub for information, maps, official data and resources about the spread of the coronavirus in Australia and around the world.