With a growing demand for underground asset maps, there’s a need for scalable solutions that ensure data quality and clearly identify data ownership. This instalment of my three-part blog explains how data is managed to deliver an efficient solution.
Ownership of spatial data and representation
Changing from a referral service to an instant-response solution involves consideration of who is responsible for ownership of the spatial data and its representation. Is it the one call service provider? Esri Australia as the solution developer? Or the asset owner themselves?
A key tenet of our solution was to ensure each asset owner is responsible for maintaining their own data and managing its representation.
To achieve this, each asset owner is “sandboxed” to isolate their data, symbology and output preferences.
The asset owners choose how their data is stored and presented to the enquirer. The data is not transformed into a common data model and maps are not generated using a solution-defined representation.

Alternative solutions using a “big bucket” approach that forces all asset owners’ data into a common data model with a common representation are not feasible for such a diverse set of utilities, local governments, petroleum companies and other underground asset owners.
Any approach to transform the asset data would lead to an increased transfer of risk from the owner of the data to the service provider – something we aimed to avoid.
Federated services
Many organisations are already exposing their asset data through geospatial web services — either internally or with the public. We looked at how they could leverage their existing services within the solution using a federated services model approach.

-
Spatial data services – the asset owner can register their OGC WFS, WMS or ArcGIS server services with the solution and for each enquiry we fetch the necessary data or images. The one call service uses this to generate the necessary response documentation centrally and shares it with the enquirer.
-
Map production services – the asset owner registers a print service with the solution. For each enquiry we pass the request to the registered print service on the asset owner’s server and a PDF map is returned before being stored centrally and shared with the enquirer through the one call web portal.
-
Custom APIs – a custom HTTP request is defined that will be called for every enquiry. The asset owner has complete control of the production of the necessary responses which are returned to the enquirer through the Next Gen UI.
Each of these services has pros and cons with a key difference being the processing load handled by the Next-Gen DBYD solution versus the asset owners’ own systems. Taking into consideration the growing demand in enquiries, the centralised processing service reduces the import on the asset owners the most.
User experience
Users of services such as Dial Before You Dig are varied, each with unique needs which must be taken into consideration when developing a solution.
Some users will be making dozens of enquiries a day, requiring a low-friction quick-to-use application; while others may only use the service a few times a year and will not be as familiar with the system.
To develop the best user experience, we ran several workshops with a variety of user types to understand how to deliver a fast, intuitive and frictionless interface for enquiry lodgement.
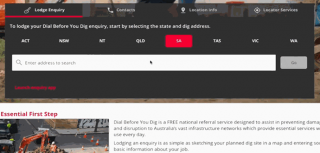
One of the key outcomes was that users struggle with sketching a dig site on a map.

The solution offered a text-based location-search with fuzzy logic that caters for misspellings, incorrect suburb names and so on. Also, we found that a user will typically work in roughly the same area from job to job, so it’s also useful to open the map to the last location.
These minor adjustments, when used together, improved the user experience.
Data Quality
Data quality is an important consideration when it comes to sharing plans. Quality can mean positional accuracy, completeness of data, classification correctness or how up-to-date the data is.
Australian Standard AS-5488 provides a classification system for subsurface utility information, rating the quality levels from A to D based on a combination of how the information was generated, the available attributes and positional accuracy of the data.
Level A requires a horizontal and vertical accuracy of less than 5cm. The data being served through Dial Before You Dig in Australia is level D as it is based on existing records rather than any sort of local site survey.
Data quality differs by asset owner and even within a single asset owner’s data set, given that some assets were buried decades ago.
The challenge for a solution like this is how to represent data that is known to lack positional accuracy on a map. Some of the things we took into consideration:
-
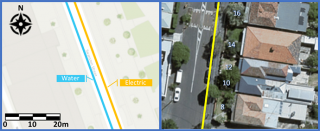
Showing multiple asset classes on a map may lead the viewer to assume relative positioning. In the diagram below, once you’ve found the water pipe do you assume the electricity cables are a couple of metres to the east?
-
Multiple layers of information can hide each other when viewed on a single map. A line representing a low voltage cable might obscure another line representing a high voltage cable running under the same lane.
Not all infrastructure being captured. For example, a lot of plans miss the final service connection to each house ending in the street. In the diagram the gas main is shown but connections to individual houses are not.

Our approach was to (a) limit the number of asset classes shown in any one view and (b) ensure the asset owner is in complete control of their data representation. The asset owner decides on the layer ordering and symbology regardless of response map being digital or printed.
It’s tempting to show all asset data on a single map, however that can make it difficult for the viewer to comprehend the different information and encourages misperceptions relating to relative positions.
I believe that the future state for underground asset identification should be the augmented reality viewer allowing the excavator to stare through their iPad to see what lies beneath.
The data available today doesn’t allow for this, it but the Next-Gen One Call pilot future-proofs the solution by supporting this model.
Map production at scale
Australia’s one call service alone handled over 1.9 million enquiries in 2017 resulting in over 10 million referrals. With a single instant-response service, this could lead to 3,000 PDF map documents being generated per hour — scale that with an expected 10% annual growth in Dial Before You Dig enquiries.
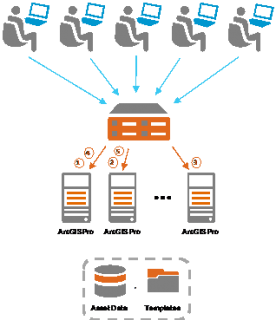
Using ArcGIS Pro for map production, the solution takes advantage of the horizontal-scaling capabilities of Amazon Web Services to meet any increase in demand. As a powerful multi-threaded application each instance of ArcGIS Pro easily takes up the load of multiple map production requests in parallel.

Since the enquiries for underground asset maps are not uniform throughout the day this architecture allows us to ramp up to meet the demand at the busiest time of day (9am to 12pm) and then wind back down during the quieter times (9pm to 6am).
In the next part of this blog series, I will show how we apply a security layer between the enquirer and the asset owners’ data to maintain the integrity of the enquiry first approach to sharing.
Explore more of Gary's blogs here.
To find out more about SmarterWX, visit the product page, call us on 1800 870 750 or send us an email.
Note: The views and opinions expressed in this article are those of the authors and do not necessarily reflect those of DBYD SA/NT or AADBYDS.

