Future advances in hyperspectral imagery promise to be a boon for mineral exploration. And while remote sensing technology is improving rapidly, not just any satellite can capture the quality of imagery needed to accurately decide where to look closely for deposits of copper ore, zinc, or other minerals.
Despite the recent proliferation of satellite technology, there are only a handful of satellites with the technical quality, ground resolution, and spectral range useful to exploration geologists.
Explore imagery and remote sensing solutions
“Very few of the satellites currently orbiting the earth can measure rock, mineral, soil, and vegetation features at the scale of interest required by the mining and petroleum industries,” said Dan Taranik, managing director of Exploration Mapping Group, Inc., based in Las Vegas, Nevada.
Taranik should know. He has more than 30 years of experience in the mining and petroleum industries. His company specialises in providing remote sensing services to natural resource companies worldwide, often delivering finished products to customers that use Esri software in formats such as map packages.
“The vast majority of satellites being launched today—known as ‘smallsats’—are simple red, green, blue, and near-infrared platforms that lack the ability to map specific clay and iron minerals that are key to discovering new mineral and hydrocarbon resources,” he said. “Smallsats are fine for capturing colour imagery over an area but not up to the task of detecting the specific minerals associated with copper, gold, and diamond deposits or the signs of vegetation stress in individual plants and trees.
Taranik's company primarily uses WorldView, Advanced Spaceborne Thermal Emission and Reflection Radiometer (ASTER), Sentinel, and other industrial-grade superspecteral instruments with 15 or more high-resolution spectral bands to capture imagery.
The Mineral Frontier
Remote sensing has been used for many years to explore for minerals. Initially, aerial surveys were flown to capture images of an area where a known mineral in substantial quantities was located. These images would be compared with those of other locations having similar exposed outcrops. Image analysts would examine the two sets of photographs and try to determine the likelihood that the new area would also contain the same mineral before sending expedition teams to further explore and evaluate the area.
In the post-World War II era, satellite sensor technology evolved to include radar and infrared cameras. These new sensors had advantages over conventional aerial photography because of their ability to see through cloud cover and even spot camouflage. Remote sensing analysts working with these new sources of satellite imagery, however, still relied on the same compare-and-contrast methods pioneered in the original aerial surveys: essentially looking for areas with similar surface characteristics as known mining deposits.
Initiated by geologists from the United States Geological Survey (USGS) and sent up by the National Aeronautics and Space Administration, (NASA), various Landsat satellites have been continuously collecting data for nearly 50 years. In addition, there are approximately 15 other countries and agencies that have subsequently launched their own space missions for scientific research, with a combined total of 4,994 satellites currently in orbit. Today, mining companies employ specialised companies to analyse spectral data of specific areas collected by the satellite constellations that circle the earth to help them determine likely locations for mineral exploration and mining.
The Art and Science of Spectral Analysis
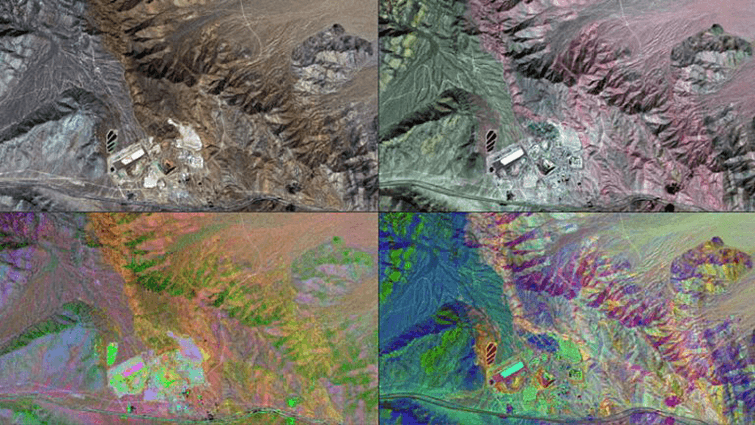
More than 4,000 natural minerals can be found on the earth, and each has its own unique chemical composition. The amount of solar radiation that a mineral reflects, transmits, and emits due to its chemical composition is like a fingerprint, or what is called a spectral signature. By measuring the tiny wavelength variations with remote sensing, a mineral’s spectral signature can often be identified from space.
“Our company analyses the spectral imagery obtained from earth observation satellites to identify and map mineral signatures, as well as determine where oil and gas pathfinder minerals may be located for our customers,” Taranik said. “The WorldView-3 satellite, for example, has such high spectral and radiometric quality that we can measure ethane and methane gas leakage in the atmosphere after the proper atmospheric corrections have been applied to the data.”
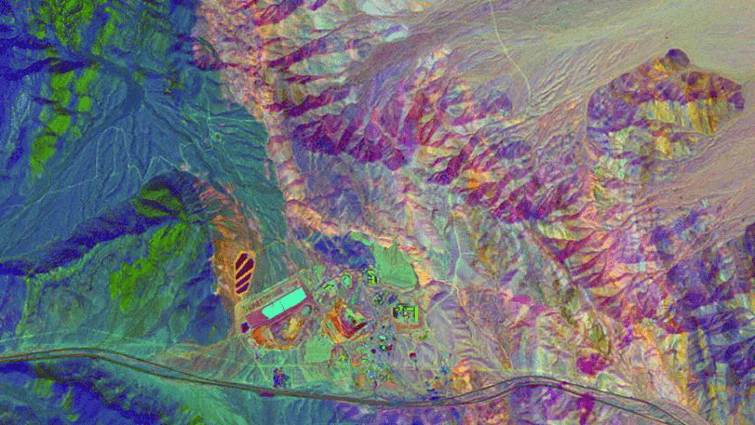
WorldView-3, launched in 2014, is a satellite constellation that was developed by DigitalGlobe (now Maxar Technologies) and built by Ball Aerospace & Technologies. The WorldView-3 remote sensing platform was designed, in part, for geological exploration. Its single panchromatic (pan) spectral band is used to rapidly collect high-resolution imagery, which is particularly useful for capturing sharp image detail (30 cm/12 in. pixel resolution). The visible and near-infrared (VNIR) system collects eight high-resolution (1.2 m/4 ft., 1 in. pixel resolution) multispectral bands used primarily for iron minerals, rare earth elements, vegetation health, and coastal and land-use applications. The pan and VNIR systems are complemented by eight shortwave infrared (SWIR) bands (3.7 m/12 ft., 2 in. pixel resolution) for the measurement and mapping of clay minerals and an atmospheric sensor known as CAVIS (Cloud, Aerosol, Vapour, Ice, and Snow) with an additional 12 spectral bands. CAVIS bands provide very accurate atmospheric corrections of the imagery for the effects of clouds, aerosols, vapour, ice, and snow.
Metallic ore deposits and their constituent minerals have characteristic properties that are visible using different wavelengths of light beyond the visible range. Those unique properties can be evaluated to map the distribution of specific minerals.
To do this, Taranik's company uses a variety of image processing approaches including spectral curve fitting; multivariate techniques; decision trees; log residuals; spectral libraries; mineral mixing/unmixing; subpixel mixture analysis; and, more recently, artificial intelligence and pattern recognition to determine which minerals are present.
Not all approaches work the same way everywhere in the world; what tools Exploration Mapping Group, Inc., uses depends on the commodity of interest, geological model, vegetation cover, and terrain characteristics.
In some especially difficult terrains for optical imagery, like the perpetually clouded regions of Brazil, Papua New Guinea, and parts of Africa and South America, we use radar satellite imagery to penetrate cloud cover,” Taranik said. “We are also using the vegetation cover to our advantage to measure the vegetation stress of individual plants and trees for our clients.”
The Original Big Data
Most Exploration Mapping Group, Inc., customers are ArcGIS users. “We deliver our data to them in a format they can use,” said Taranik. “We are longtime ArcGIS users and normally provide our finished products in multiple Esri formats—usually a map package including multiple raster formats, a geodatabase, and/or shapefiles—so the mapping layers can be easily overlain with other datasets.”
Taranik said that satellite imagery is the original big data type, and his company's deliverable products are routinely over several hundred GBs in size. “We have found the Esri pyramid lossless raster compression is especially useful so that large datasets display quickly on normal computing hardware, and other specialised image processing software isn’t necessary to view it.”
The type of satellite imagery that Exploration Mapping Group, Inc., recommends using and processes is based on how a customer plans to use that imagery.
When a customer wants to look at large regional areas, Landsat imagery would be a good choice. “If you want to map all of southern Peru, for instance, it would probably be around 30 Landsat scenes,” Taranik said. “This would give you a broad view for mineral exploration—where access routes exist, [where] geological contacts [are], where rocks and soil are exposed—as well as any visible alteration in the geology that suggests where you might want to follow up with more detailed mapping, geochemical sampling, or drilling.”
Exploration Mapping Group recently completed a large survey of over 6,000 square kilometres in size for an area in the world that is, in Taranik's words, “experiencing a modern-day gold rush.”
“The client wanted to see every boulder, geological contact, and concentration of alteration minerals in the vast but remote region,” he said.
Taranik said plans are also being made to collect satellite data over hundreds of square kilometres of land in another area to look for unique circular features that have a “kimberlitic” clay mineral response in them. An igneous rock, kimberlite can sometimes contain diamonds.
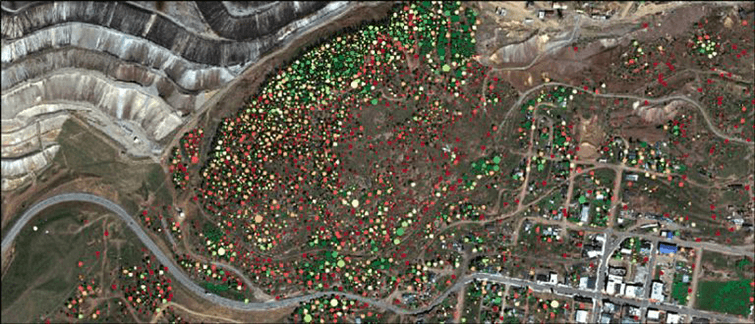
Satellite imagery also can be used to detect the presence of ore in heavily vegetated terrains of Southeast Asia. “We can detect and map rock alteration and primary ore mineral signatures between the trees, in dirt road tracks, on animal and human footpaths, and the upturned soils of artisanal agricultural fields,” said Taranik. “We can identify a lot of different minerals and in what quantity from space. It is opening up new regions of the world to spectral mapping and geoscientific applications that would have been missed by the previous generation of resource satellites.”
The Sky's the Limit for Satellite Services
Some governments and large companies use satellite constellations like WorldView-3 that have extremely high data quality—very good geometric precision and bit depth that provide great radiometric accuracy in their measurements, according to Taranik. “There are some governments that will be launching hyperspectral satellites in the next few years that will provide even greater hyperspectral ranges,” he said.
Taranik also points to the growing number of nano- and microsatellites that are very inexpensive in terms of relative cost, but a small number are expected to fail at launch.
“The data quality is not as high as the top-end satellites,” he said. “But if your application requires red, green, blue, and visible near-infrared reflectance for mapping or change detection or repeat coverage of an area within a single day, you’ll be able to get it from these satellites.”
Sensors used by unmanned aerial vehicles (UAVs) tend to be on the lower end of the spectral capability and camera quality and are largely restricted to line-of-sight applications over specific mine sites for stockpile volume measurements, according to Taranik. He said that aerial surveys using traditional aircraft face challenges such as difficult remote site access, pilot and instrument technician costs, sensor import and permitting regulations, mechanical failures, and weather delays that can be very complex and expensive.
“We can literally jump over these limitations with ‘open skies’ satellite technology, where sophisticated imagery can be acquired and processed within days or weeks of an order for any location in the world,” Taranik said.
The WorldView-3 satellite, for example, orbits earth once every 97 minutes and passes over the same point on the earth at mid-latitudes once every three to five days. The Maxar collection planning team includes dedicated weather specialists for every region of the globe who look at historic cloud cover, monsoon periods, snow cover, and any existing competition for satellite time to accurately determine the time required for collecting new imagery.
Once a client confirms an order, Taranik said it's not unusual for cloud-free images to be collected the next day.
Business Opportunities in the Cloud
Exploration Mapping Group, Inc., uses Esri ArcGIS Desktop applications, such as ArcGIS Pro, to process and enhance images and conduct vector analytics. (Read about the extensive enterprise image management capabilities of ArcGIS Pro.) “We also use Esri tools to create the final images, spatially validate them with the Check Geometry tool to catch any errors and deliver them in an ArcGIS map package and geodatabase format,” Taranik said. “The vector analytics are especially useful with polygon overlay and intersection to generate maps with specific exploration and environmental areas of interest based on multiple layers of input.”
Taranik said Esri has become very sophisticated in terms of its flexible IT infrastructure models, data center deployment, portal interfaces, authentication, and the distribution of data to end-user clients. “And now, [Esri is] leading in the migration to cloud storage and data management. Along with the advances that are being made in data processing, this will increase the potential for continued expansion of mineral and petroleum exploration companies using remote sensing.”
Taranik sees the cloud being a game changer in his space, proving new business opportunities. “Sheer processing power [is] needed to process and deliver large datasets, [and] security is a concern because there is always the risk of getting hacked,” he said. “So setting up effective cybersecurity is essential, and Esri leads the GIS industry with those capabilities.”
With ever-improving satellite technology, Taranik sees a bright future for mineral exploration.
“The latest satellite technology provides exploration geologists with the ability to rapidly screen large areas in remote places for mineral and petroleum potential,” Taranik said. “It helps streamline exploration efforts and costs by reducing financial commitments for mineral leases, avoiding unnecessary ground-based environmental impacts and ensuring labour-intensive field operations are focused on the best areas. The remote sensing tools available today are an order of magnitude better than what we had just five years ago.”
Want to know more? Talk to us about GIS applications in mining or imagery and remote sensing solutions.
Blog author: Jim Baumann is a longtime employee at Esri and has written articles on GIS technology and the computer graphics industry over more than 30 years.