As the sole health authority in Western Australia, WA Health covers the largest area for a single health authority in the world, with a population scattered across 2.5 million square kilometres. Consequently, delivery of community services is highly dependent on location.
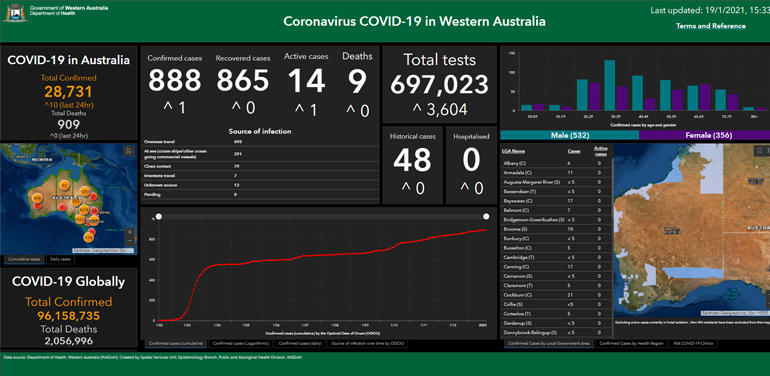
It's perhaps no surprise then that WA Health delivered one of the most advanced COVID-19 dashboards in the country – including source of infection, active cases by local government area, demographic data and COVID-19 clinic locations.
The usability of the dashboard has sparked public interest, with Chief Health Officer Dr Andy Robertson stating that it had received 9,000 hits a day and exceeded 1 million views since its release. The dashboard's success echoes the viral spread of the Johns Hopkins' COVID-19 map – which received over 1 billion visits a day at the height of the pandemic.
The Western Australia COVID-19 dashboard has received over 1 million views and averages 9,000 hits a day. – Dr Andy Robertson, Chief Health Officer, Western Australia
The high level of engagement with WA Health’s dashboard illustrates not only the desire for public information on COVID-19 – but also the importance of location analysis in resource allocation and service delivery.
Spatial analysis enables government authorities to prioritise historically underserved or vulnerable communities and to forecast future demand for services and amenities.
While the COVID-19 threat remains under control in WA, prevention, community care services, chronic disease and mental health services will remain of strategic importance for WA Health.
WA Health’s vision for the future
The Department is looking to expand its geospatial capabilities in four key areas:
1. Robust, near real-time contact tracing: With the right spatial infrastructure in place, the Department can rapidly integrate spatial and non-spatial health data to monitor pandemics and infectious diseases. Tools such as Survey123 enable on-the-fly data capture, which can then be analysed in ArcGIS Pro Intelligence to visualise case clusters and patterns of concern.

2. Whole-of-department dashboards: The department is looking to increase the adoption of hubs and operational dashboards, seamlessly integrating disparate data into a single-source-of-truth for all business units.

3. Vulnerability mapping: Mapping locations of at-risk populations – based on age, living situation, income and pre-existing health issues – generates immediate insight into areas where COVID-19 cases or other serious illnesses may spike, enabling targeted investment into healthcare infrastructure and services.

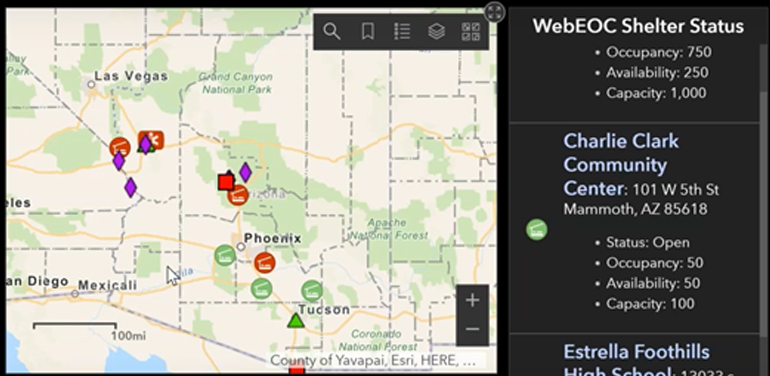
4. Enhanced emergency management: During large-scale emergencies, easy access to geographic information systems data is critical. By integrating near real-time WebEOC information within ArcGIS Online applications, WA Health aim to improve coordination and response times.

Location analysis will be key in ensuring that Western Australians continue to enjoy a standard of health that is among the highest in the world.
Visit WA Health’s COVID-19 dashboard here.
For more information on how GIS can help shape a healthier future, read the case study.
Explore another example of WA Health's innovative approach to tracking the pandemic:


