Geographic Information Systems (GIS) have revolutionised the way we approach scientific research. By combining spatial data with advanced mapping technology, GIS allows us to analyse and visualise complex data sets that were once impossible or overly time consuming to interpret.
Marine science research is a perfect example of a field that benefits greatly from GIS technology. Researchers can use GIS to map and analyse marine habitats, track the movements of marine animals, monitor behavioural patterns, and monitor changes in ocean temperatures and currents.
Many marine animals, such as sea turtles, whales, and sharks, migrate long distances across the ocean. GIS technology allows researchers to track the movements of these animals using satellite tags and other tracking devices. By mapping the movements of marine animals, researchers can gain insight into their behaviour, habitat preferences, and migratory patterns. This information is essential for understanding the ecological roles of these animals and identifying areas that may need protection. Esri Australia recently embarked on an opportunity to implement ArcGIS technologies into a university research project exploring the migrations and behavioural patterns of tiger sharks (Galeocerdo cuvier) on Norfolk Island.
The Research Project
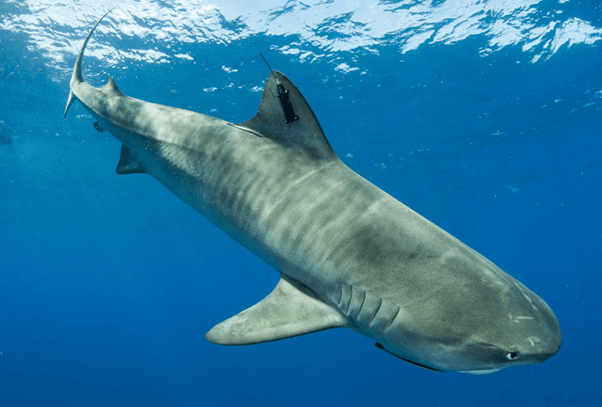
In the crystal waters around the beautiful remote island, we can find one of the largest aggregations of adult tiger sharks in the world. Large tiger sharks - many larger than 4m - regularly frequent Norfolk Island’s waters. Locals and scientists alike had many questions around this aggregation, such as why are they there, how does their presence affect the ecosystem?
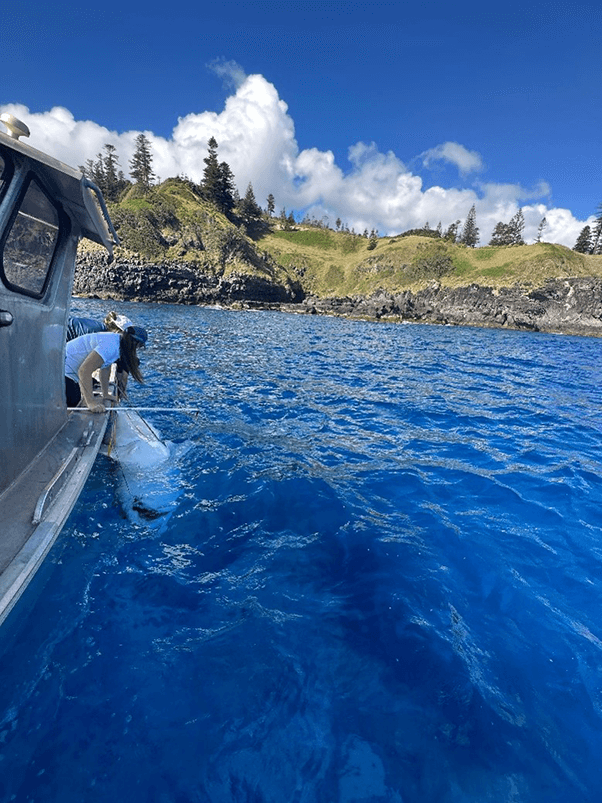
To answer these questions, a team of researchers from Flinders University and Biopixel Oceans Foundation initiated a project to monitor and track the movements of Norfolk Island tiger sharks.
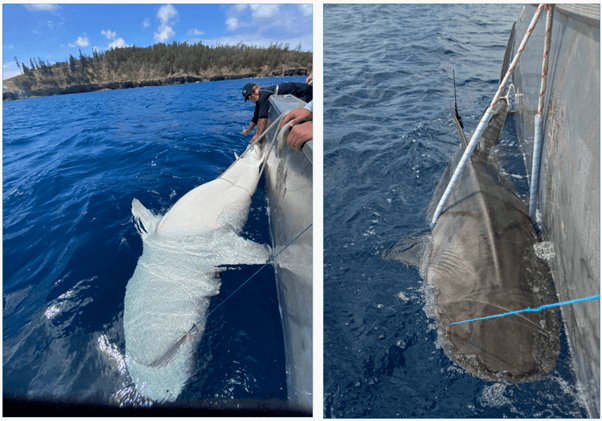
The trip involved catching tiger sharks then tagging them with satellite and/or acoustic transmitters. Satellites then transmit the tag information to receiving stations. This allowed the team to download the dataset for analysis in ArcGIS Online to create accurate, reliable maps of tiger sharks' movements in real time.
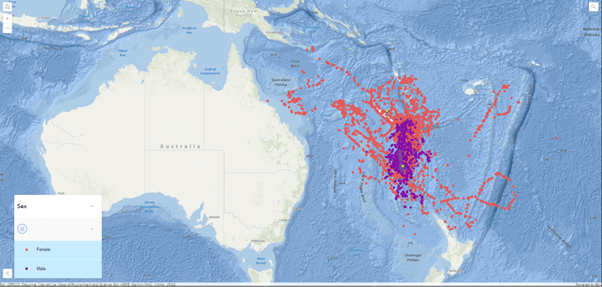
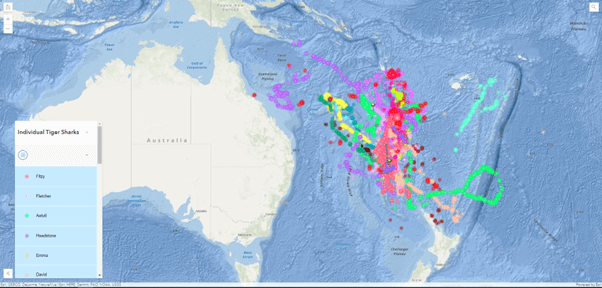
Once the data was collected, ArcGIS Online was able to categories the data to show the shark genders, the seasons and the individual sharks’ movements.
This information was critical for the researchers and influenced the next steps of their research. This analysis of data would have taken hours of work manually, however, using ArcGIS this process was almost instantaneous, allowing the research team to make informed decisions and view real time data.
The team also used ArcGIS Survey123 to continue a citizen science program while they are back in Australia, allowing the team to continue collecting essential data without even being on the island.
The involvement of ArcGIS within the data analysis of this project ensured the team had more time in the field collecting essential data, rather than in the office doing the analysis.
To view the full story of the Norfolk Island trip read our ArcGIS Storymap. If you have a university research project that you think ArcGIS could assist with contact Jennah Williams on education@esriaustralia.com.au.