Gaining insights from vast amounts of big data is essential for organisations seeking a competitive advantage. See how GIS technology is helping uncover hidden patterns in millions of global shipping data records.
Recent advances in Geographic Information System (GIS) technology allow organisations to take advantage of big spatial datasets with relative ease.
Maritime organisations are awash with big spatial data: on-board remote sensors constantly collect information about every aspect of vessels and the environment including details of weather fronts, wave heights, chlorophyll concentration and more, leading to insights that can be used to make important operational decisions.
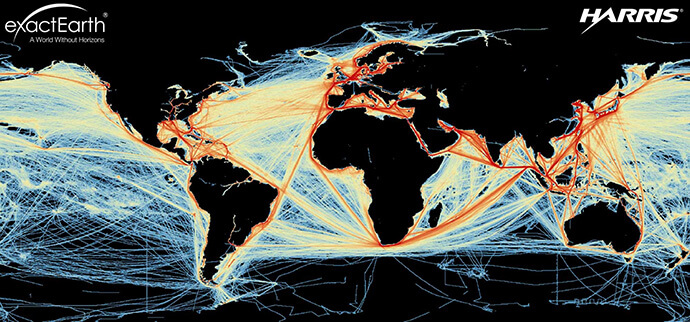
Automated Identification Systems (AIS) broadcast data about a vessel every few minutes. By law, any vessel longer than thirty metres must have AIS installed. This results in more than a quarter of a million vessels broadcasting their location globally throughout each day.
AIS datasets include many fields of information, including vessel ID, location, speed, course, vessel type and more.
Understanding this information is crucial to the success of any maritime organisation. The data helps vessels safely navigate high sea states, find high-yield fishing spots, avoid pirates and in the case of AIS, locate other vessels in real time.
Information received from AIS is invaluable. By broadcasting this information and receiving AIS data from a feed – such as one provided by exactEarth or ORBCOMM – a vessel can see the positions, speed and course of other vessels and avoid collisions.
It can be just as important to identify a vessel which is not broadcasting, or which is spoofing its location as this can indicate illegal activity or a technical problem.
AIS is also important for organisations looking at the big picture. Organisations will gain visibility of vessels that are entering protected areas, they will map shipping-lane density, or they may uncover anomalies that indicate early signs of distress, such as a vessel going dead-in-the-water in open ocean.
When an organisation works with AIS, they will usually be looking at a subset of a global dataset; these are still huge datasets.
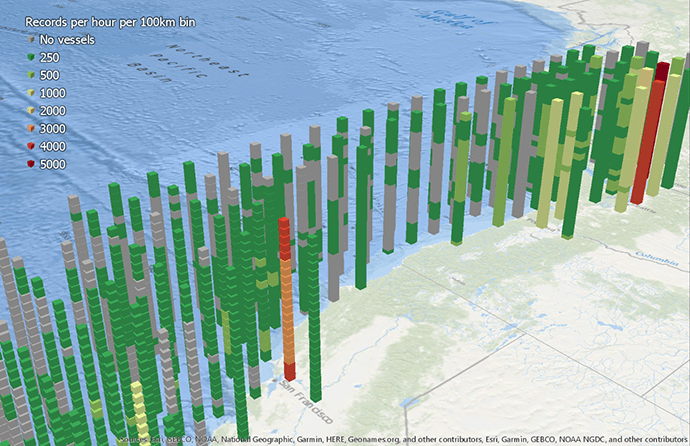
In Australian waters over one hundred million records are generated annually; West Coast of the US generates over thirty million records a month.
AIS data is a great example of the Vs of big data:
-
Volume – millions of records are created each month
-
Velocity – each vessel broadcasts data at less than five-minute intervals
-
Variety – there a many different fields containing values, text and dates
-
Variability – a single vessel may change between and activity types and patterns of life
-
Veracity – there is an element of uncertainty and anomalous results and frequently reported
-
Visualisation – the ability to visualise location data is required to achieve situation awareness
-
Value – correct and timely understanding of data lead to effective and fast decisions
Because AIS datasets are big spatial datasets, maritime organisations require a big spatial data solution to deal with them.
Workflows around AIS datasets can be time sensitive and need to be comprehensive for decision makers to work quickly.
Desktop Geographic Information Systems are able to handle datasets containing several million points, but processing times can take several hours and take up workstation resources.
There’s a huge appetite in organisations for big spatial data, but it’s not always easy to digest.
This is where distributed computing can help. By using Enterprise GIS software on servers and in the Cloud, analysts can run geoprocessing tasks on more powerful machines.
These tasks take a fraction of the time to complete in the Cloud compared to desktop, and the analyst is free to continue using their workstation. A more sophisticated set up can allow these tasks to be automated and map products generated at regular intervals.
In this example, I chose GeoAnalytics Server to process AIS datasets because it will run tasks that are too large for desktop hardware, it can process large vector and tabular data with both spatial (location) and temporal (time) components and is specifically designed for fast distributed analytics and storage. The GeoAnalytics server interface is easy to use and accessible from ArcGIS desktop or in the web.
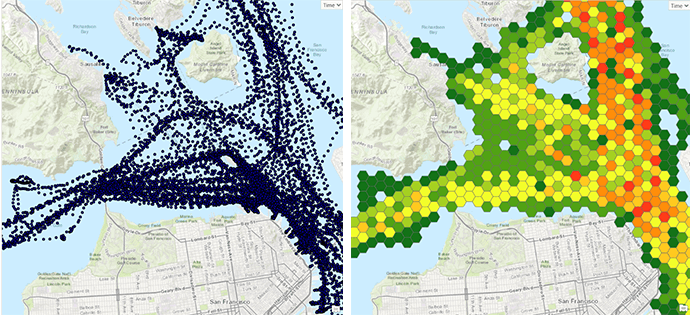
The screenshots of results show the one million points I processed using the big data server deployed on Microsoft Azure. I was able to run tasks like vessel tracking and aggregations for the entire US West Coast in one minute. Once the task was complete, the results could be visualised on the desktop or in a web browser.
As this was deployed on the Cloud, I was able to turn off the Azure server after running my tasks to save credits, making this an economical task to run.
Another option for fast distributed analytics is to use Insights for ArcGIS, which allows for on-the-fly processing of data.
You can try Insights for ArcGIS with a free 21-day trial of the ArcGIS platform.
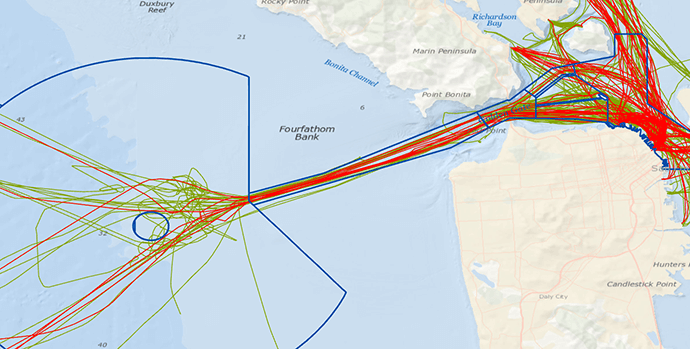
The video in this blog shows how I was able to filter out points using shipping lanes, view the fastest vessels and create a time series chart, all using drag and drop commands in a web browser in less than a minute. In this case I used Insights deployed on ArcGIS Online which is a Software as a Service offering ideal for organisations not wanting to invest in their own infrastructure.
By using this software I was able to run processes in minutes instead of hours and quickly produce maps and identify anomalies. I was also able to work with the temporal aspects of the data, filtering results by time and investigating patterns over time. I could find the ‘needle in the haystack’ by pulling out the largest values and querying the tracks of individual vessels.
The solution was also easy to deploy as it worked with my existing ArcGIS Enterprise deployment and could scale out if in future I was working on larger projects.
With access to a big spatial data capability, maritime analysts can work much more effectively while still using familiar GIS interfaces to extract the insights that lead to effective operational decisions.
This example shows how big spatial data analytics can deliver insights for maritime operations. The same technology can be applied to any industry or organisation where location-based analytics can help gain insights.
To find out more about gaining insights from big spatial data, call 1800 870 750 or send us an email.