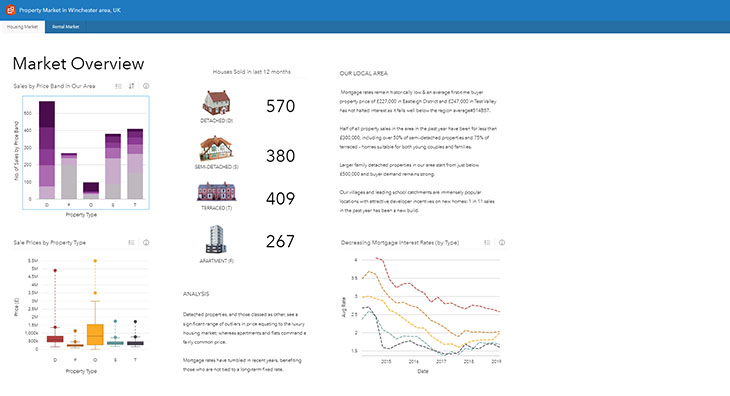
Fuse location analytics with open data science and business intelligence workflows to answer questions you didn’t know to ask and unlock new insights. Empower analysts of all skill levels, across departments, to directly connect data, perform advanced analytics, and take results into third party systems.
Powerful analysis, made simple
Revolutionise decision-making with analysis that visually informs your organisation of new, previously unexplored insights gained from the perspective of “where”.


Analyse data from multiple sources
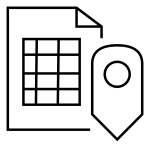
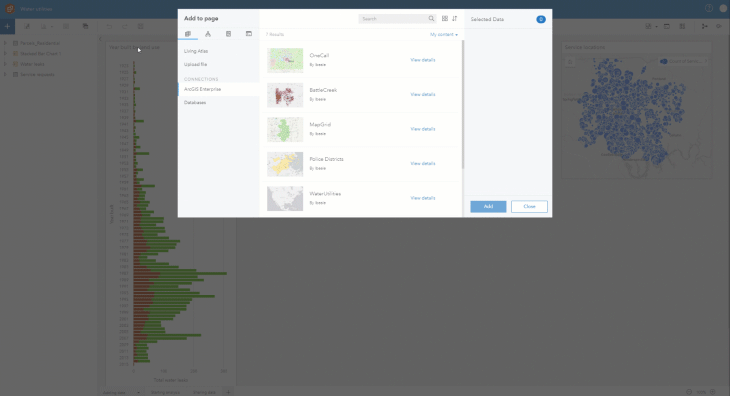
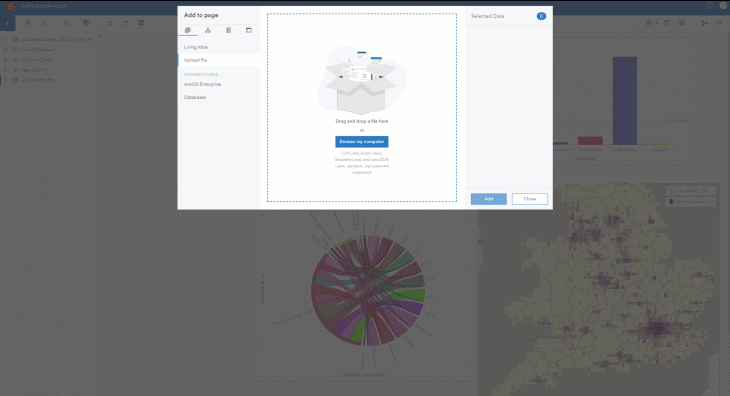
Using multiple tools to accomplish one thing? Benefit from intuitive, visual analysis that brings location and business data together. Directly connect to data, whether it’s in ArcGIS, relational databases, spreadsheets, or from ArcGIS Living Atlas of the World.
Answer questions you didn't know you had
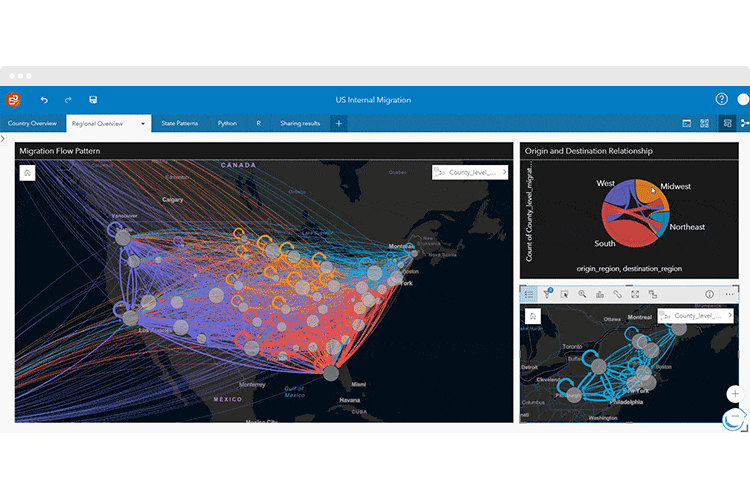
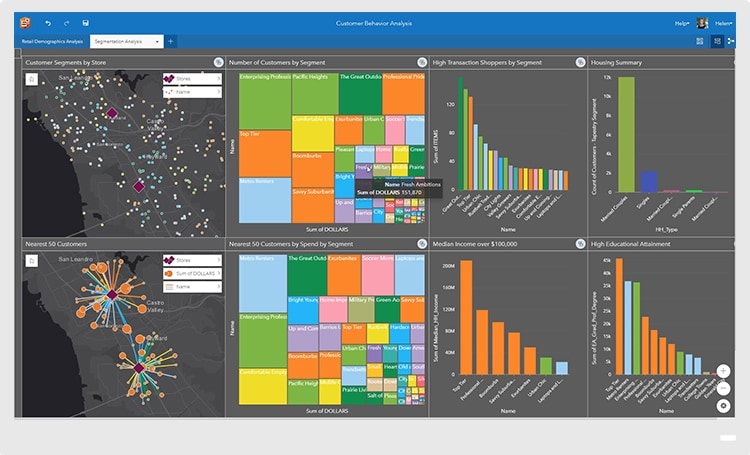
Transform complex datasets into manageable information by visualising data. Use exploratory analysis techniques to quickly uncover patterns, trends, correlations, and relationships. Use advanced analytics, such as spatial, statistical, and link analyses, to further analyse data.
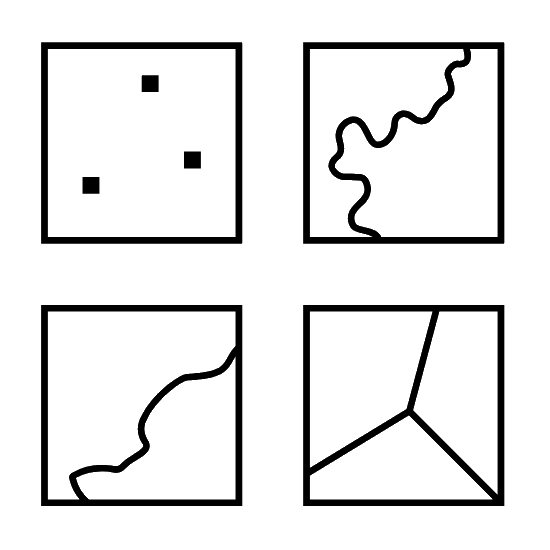
Map any location value and analyse it
Map any value with projection and location accuracy - addresses, coordinates, lines, or boundaries. Work with an unlimited number of map layers at once. Perform advanced spatial analysis techniques, such as spatial aggregation, drive times, and Find Nearest, in three clicks or less.
Close gaps with location data
Enrich your data with variables such as demographics, psychographics, and socioeconomic data. Tap into the world's largest collection of ready-to-use geographic content for over 130 countries. Perform granular analysis that scales from down to local geographic levels.
Let data tell the story
Transform your analysis into interactive data stories. Create reports that use text, links, images, videos, and branding to clearly communicate your results and show how you reached them. Publish reports internally or publicly to keep stakeholders informed, helping you gain support and buy-in.
Ready to learn more? Contact us to speak to a product specialist.
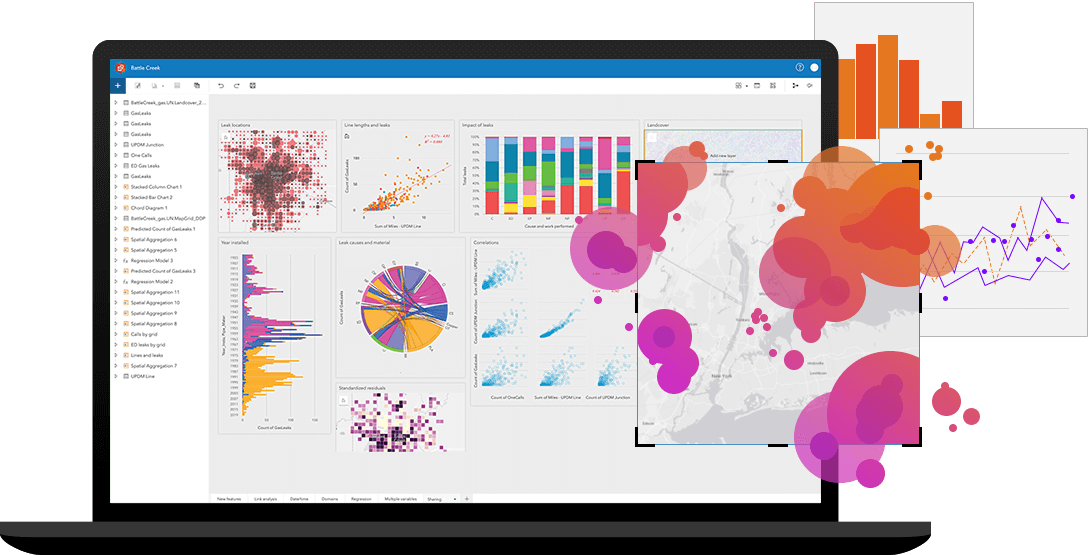
How ArcGIS Insights works
1. Bring in your data
Directly connect to your data. Put your data onto a page by performing a drag-and-drop operation. Visualise data on cards as maps, charts, and tables to unlock endless possibilities for analysis and data exploration.

2. Find answers in your data
Analyse data with ease. Answer questions that guide you to the best tool or dive right into analysis. Quickly aggregate data on a map; reveal hot spots and outliers; make predictions; join data spatially; show relationships between people, places, and events; and more.

3. Show you work
Clearly communicate how you arrived at your results. Share a step-by-step model of your analysis or create an interactive data story that informs internal or external stakeholders.