Bringing a digital twin to life

How do you visualise a digital twin? In Part Two of this series, Wayne, Ta and Mary discuss how to build a digital twin by harnessing real-time data and considering audience and purpose. They delve into groundbreaking examples from across the globe and provide a comprehensive overview of the GIS tools you’ll need to make it happen. 

Check out Part One

  SUBSCRIBE:

Apple podcast badgeSpotify podcast badgePodbean badgeGoogle podcast badge

transcript iconVIEW TRANSCRIPT

Subscribe for more short, sharp and immediately usable tips and insights. 

Got a burning question or a hot topic?

Connect with the hosts

Ta Taneka profile image
Tariro Taneka
Program Manager, User Journeys
Esri Australia, Brisbane
Ta is the designer of the trailblazing ArcMap to ArcGIS Pro Migration and Web GIS enablement programs leading a new breed of GIS adoption specialists.   
Wayne Lee Archer - GIS Directions 1
Wayne Lee Archer
Sector Principal Consultant
Esri Australia, Brisbane
One of Australia's leading curators of spatial information and modern technology.
Mary Murphy - GIS Directions 2
Mary Murphy
Consultant
Esri Australia, Perth
Experienced GIS and remote sensing specialist

Stay in the know

Be notified when new episodes go live and submit your topic ideas below.

  • Click to view the episode transcript

    Wayne: We’ve been twinning for as long as GIS has been around. What we’re doing is, taking the real world and making some other kind of presentation of it. It just so happens that technology and the nexus of all of the capabilities that we’ve got right now in this point in time, mean that we can do that in 3D. 

    DISCLAIMER:  This podcast is brought to you by the team at Esri Australia. To get your hands on more short, sharp and immediately useable resources, head to the Esri Australia website and search for ‘Goldmine’. 

    Wayne:  Welcome to GIS Directions. I'm Wayne Lee Archer.  

    Ta: I'm Ta Taneka.  

    Mary: And I'm Mary Murphy  

    Wayne: Welcoming everybody back for the second part of our first three-part series on digital twins and if you missed the first episode, I'd highly recommend that you check it out before you join us for this session. 

    Ta: Okay. So if I recall correctly, we discussed the four pillars that form the framework for digital twins. So that's data capture and integration, real-time and visualisation, sharing and collaboration. And these all form the basis of, you know the um ‘how’, and finally analysing and predicting, which really um focuses on the ‘why’ we would build a digital twin. 

    We also talked QuickCapture, ArcGIS Urban is one of my favourite tools as a planner myself, Drone2Map and Site Scan, and end-user tips on how to get started. So we focused on leveraging what we know and building on from there. 

    Mary: So that’s the first thing we did, that first pillar. But, we've started, we want to start building this digital twin. Wayne, I'm going to throw to you, What do we do? How do we start? How do we lay this first block? 

    Wayne: Now the second pillar really is the visualisation pillar. This is the super exciting bit. I can see Ta's eyes lighting up because it really speaks to the humanist side of things. And so, let's talk about that real-time visualisation and that real-time data component of digital twinning. 

    Mary: I suppose for me it's very much around that definition that we talked about last time, that definition of what a digital twin is; that virtual representation of the real world. 

    And we said there are lots of ways that we can represent our data at different scales and so on. So it all comes down to that representation. And when you start and you jump in, and you try and think, “how can I build this thing?” I always say, “We should think about our audience and what the purpose of our digital twin is.” So, what is that visualisation going to be? Is it going to be something that meets one particular audience, multiple audiences, what's the purpose of this digital twin, and so on? 

    And then, like you said, you have that real-time aspect to this now as well. And that's really important, because real-time is not always all the time. So we need to think about what's most appropriate for our visualisation, and then as part of that package, we need to think about what's more appropriate timewise as well and if we can capture that correctly.  

    So, as with that data capture side of things, so capturing the data, integrating the data, we now want to visualise it. We now want to represent it. There are lots of ways to attack this. Any ideas?  

    Wayne: This is the tech side of stuff that I really love. So we've talked about those building blocks, your data and what are we gonna build our twins out of? We've talked about the fact that there are different types of twins; big twins and little twins. So, it's going to differ as to how much of that real-time data you incorporate in your twin, depending upon the kind of twin that you're trying to create. 

    But at the end of the day, I think we really have got a sort of a cohesive set of tools used to make these things that are used regardless of what kind or size of twin you're gonna be creating. So, we've got our data, first thing is to bring that into a visually appealing sort of environment. Classic tools here and Ta’s gonna love it, first one out of the box: Ready steady Pro. ArcGIS Pro is totally gonna be your friend here because it allows you to create both those 2D and those 3D views as well.  

    We've been twinning for as long as GIS has been around, what we're doing is taking the real world, making some other kind of presentation of it. It just so happens that technology and the nexus of all of the capabilities that we've got right now in this point in time mean that we can do that in 3D. And 3D is a good choice because that's how we experience the world.  

    So if we're going to make a good high fidelity convincing twin, then we're probably wanna  make it and build it in a 3D aspect. So Pro is totally going to be your friend. 

    Mary: So I think there's definitely two clear workflows or buckets here of the tech stack. So we can have that initial process where we want to test and prep. So bring your data into your desktop GIS – ArcGIS Pro, bring it into your online GIS your web GIS, so ArcGIS Online, for example, and play with the symbology, play with the data, the attributes, get familiar with your data.  

    If you want to go crazy in ArcGIS Online you can use ArcGIS Image, start to play with the imagery side of things, and then again, you can work with your map viewer, your scene viewer and ArcGIS Online, and get familiar with 2D and 3D workflows in your desktop and your Web GIS. 

    That's the visualisation. How do we integrate the time aspect to it. So any ideas?  

    Wayne: Plenty of ideas. I'm going to mention Experience Builder here because you can integrate 2D and 3D experiences into the same application itself and link them up so you can move a 2D map around and see the 3D world move around in your scene as well to, to match that. 

    And this is something that I'm pretty excited about, because people are familiar with navigating and using 2D maps. We want to get that digital twin aspect in there and make it 3D. Now we can bring the two together in a way that is kind of cohesive for everyone. It’s a familiar experience for everyone.   

    Ta: And for our users who are using the powerful processing power and capability of Enterprise, how do we bring in, you know, real-time through Enterprise? 

    Wayne: So there's two parts here, not just with Enterprise, but also now with your ArcGIS Online accounts, we can bring in some of those real-time feeds, some of those sensor feeds, some of those people movement feeds or the tracking of people sort of feeds. We can bring those in with ArcGIS Velocity, with ArcGIS Online. Which is super cool. 

    But, for organisations that have got their own sort of real-time data feeds that might not necessarily be, you know, available online, then through ArcGIS Enterprise, you can obviously still use good old sturdy GeoEvent Server. So GeoEvent is going to be a core part of those real-time aspects of bringing in that sensor data, bringing in that real-time data into your twin. 

    Mary: Yeah, and that's quite important if we're still in this prep and testing stage, GeoEvent Server for the Enterprise stack just cannot be underestimated. That’s what allows you to integrate that real-time event-based data streams into your workflows in as your data sources, so that's really, really important to be able to do that. 

    And then you mentioned Velocity. So Velocity is the ArcGIS Online kind of version of that would be how I would explain it to people. So, it's cloud-native add-on capabilities for ArcGIS Online. So that's kind of cool. So that allows us to ingest our data from those IoT platforms, and opens the door to that data, that streaming data that we have. And it doesn't just open the door, once we're in the room with this data, we can now actually do things with Velocity so we can actually process, visualise, analyse that real-time data. 

    But again, there are some discussions to be had around that idea of what's real-time? So if we're thinking about what is real-time, those options, things like GeoEvent Server, Velocity may not be the only options. We still have good old 'ArcGIS API for Python', if you want to symbolise and create feed routines. 

    Wayne: Well, that's, that's super important, you know, if you want to bring your real-time stuff in there, you want to visualise it in a compelling way that's meaningful within your twin. So, you know, the symbology, the way that gets represented is going to be super important, and you're going to have to rely on things like your ArcGIS API for Python, for that kind of deep, rich symbolisation. 

    Mary: Absolutely 

    Ta: Now that speaks a lot into that purpose of visualisation and prep, now what about other purposes? So, if we are looking at situational awareness, reporting, monitoring, asset management, can we quickly touch on that?  

    Wayne: Oh, I do have a little bit of a one for that whole situational awareness one Ta you, you've heard me wax lyrical on this one already – ArcGIS Mission.  

    Ta: Oh yeah.  

    Wayne: So, you know, if you've got teams of people out there in the real world, you want a real-world representation for them to work within. So, you can combine your twin with that kind of real world in field activity and actually sort of start communicating between people in the real world, in a 3D environment or a 2D environment, get live visuals out of that. 

    And Mission is going to be absolutely critical for that. Mission kind of replaces a bunch of the older tools like Collector and, and such like, and brings them into a cohesive, real-time tool that actually allows your field workers and people out in the real world to communicate in real-time.  

    So combining all of these technologies together, you can actually come up with a really compelling way to feed information out to people in the real world that is represented like it's the real world, a twin, funnily enough. And then actually get your work done and communicate amongst your workforce, all within the ArcGIS stack. So, it's exciting times really it is. 

    Ta: I can just add, I guess, asset management, uh two quick mentions here. Some of my favourite – ArcGIS Indoors for emergency management and public safety. You know, you're out at an event or so, and you just want to make sure that you can visualise all of your hallways, where your cameras are just for everyone's safety. And ArcGIS Urban from a planning perspective, again, being able to visualise your buildings and all of your assets for current and for future planning as well. 

    Mary: Yeah, that's really good. So you, you've teed me up nicely there, Ta, to segue into our next little bit by summarising kind of some of those examples in that area of situational awareness, reporting, monitoring that second kind of bucket, if you will, of how we can actually use some of these parts of the stack for particular workflows. 

    And then people have done that. People have gone out there and they've done the hard yards. So, are there some real world examples that we can direct people to, in order for them to get some inspiration?  

    Wayne: I know Ta has got one. She was talking to me about this the other day. 

    Ta: So I spoke with Sharon Gin at Esri Singapore, a deep thinker, a senior product technology manager, she’s just, she’s amazing, and we talked about the value of digital twins for a country like Singapore. So being an organised and well-planned city and country, digitally mapping their infrastructure, including underground utilities, cabling, as an example, it contributes to that well thought out space. 

    So, you know, when we start to think long term, the cost and the time to repeatedly map infrastructure, would be astronomical. So measuring and recording accurate details of infrastructure is time and cost effective when looking at digital twins, and it means authorities can quickly see how much space is available to add additional infrastructure. 

    So these digital twins in Singapore we provide an accurate point of reference where organisations, they can plan ahead, reduce cost and disruption time particularly when capital works are undertaken, so they consolidate infrastructure information into a single location and source of truth. 

    And multiple agencies then don't have to be contacted to obtain that information. So what we've seen is that the ability to visualise landscape and infrastructure in 3D, for drainage and predictive modelling and analysis, it's been extremely important, particularly in Singapore, when we’re considering predicted rises in sea levels as well as how to build infrastructure to protect coastal and low-lying areas.  

    Wayne: I've seen some great stuff come out of Singapore in this space as well. And, you know, not just in that real-time sort of twin fashion either, but also in the planning side of things. There's a great example out there of planning the transportation network in Singapore where they've actually visualised the planning of where the transportation network is going to go. 

    So there's a lot of uses for these twins that aren’t always about that real-time shimmering windows, and swaying trees.  

    Mary: You and your shimmering windows.  

    Wayne: And lovely sparkly water and cars driving around on the road.  

    Mary: Yeah, absolutely. And I just to kind of throw in the last one I suppose is that ports and maritime sector are doing amazing work. Like if we look back at the Port of Rotterdam, back in the day, they've been at that for a while. Panama Canal Authority are doing great things. Locally, Southern Ports and Fremantle Ports are doing amazing things. 

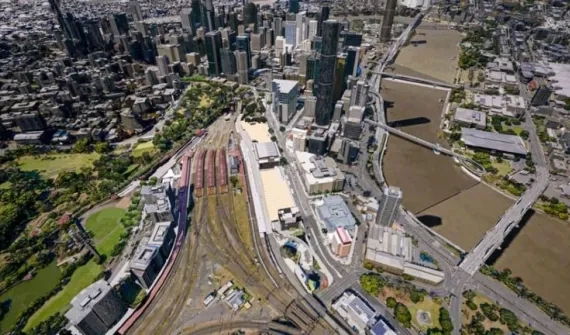
    Fremantle Ports one is really good. I keep harping on about it, but they've done lots of things. They've got static 3D models with their ships, their cranes, their buildings. They've got that near real-time camera feed in there, that AIS data live in there. That's the automatic ID system. So they can track the ships, track the vessels as they're entering and leaving. They've got bathymetric data in there. 

    They've got more dynamic ones like your shimmering water and so on in there as well, and some shadow analysis and so on. So it is an absolutely fantastic example of what you can do to create those things. So definitely have a look at those ones as well.  

    Wayne: Normally, this is about the time in the episode where we call out with those short, sharp, immediately usable tips that our audience loves so much. How about we shake it up a little bit today and get some training tips in there? How are you going to go about learning how to do this? Mary, this is right up your alleyway. Surprise! 

    Mary: Oh, surprise. Thanks for that. Yeah, no, I, so I suppose if we're going to start building these things, again, I'm going to harp back to audience and purpose, so, start with that.  

    So if we think about some instructor-led training, if we jump in and get used to the technology, we might want to start thinking about designing the things with the audience and the purpose in mind. So that kind of next step, more intermediate. So, “Creating Maps and Visualisations with ArcGIS” is a really good course that looks at thinking about what you're creating for who and why. Excellent course. 

    And then if you want to go crazy and start jumping into some individual types of visualisations, like dashboards, etc. We have a dashboards course, we have a Story Maps course. But the “Learn ArcGIS Gallery” as well has two excellent things that I'm going to shout out. 

    We have City Engine, so try ArcGIS CityEngine, And try ArcGIS Urban as well. So, if you want to jump in there, they're two really good tutorial series as well.  

    Wayne: How could I have forgotten CityEngine, CityEngine is where you get all of your lovely swaying trees from. That's where you actually get the, the reality side of things built into your 3D visuals. 

    Mary: Where you create those immersive environments, right?  

    Wayne: If you, if you want a realistic environment in terms of the gaming industry, CityEngine is definitely a tool that I'll be throwing in my twinning toolbox, that's for sure.  

    We're almost out of time today. It looks like we're going to have to pull out all stops in the next episode to cover off on the final pillars of digital twinning.  

    Ta, did you wanna kick off with the key takeaways from today? 

    Ta: Absolutely I think Mary did a phenomenal job of segmenting our second pillar into audience and purpose when thinking of real-time and visualisation. So if the purpose of visualising and analysing our real-time data, if that's the focus, you know, we can use some of our great tools in our toolkit, like ArcGIS Pro – ready steady Pro, WebGIS, so ArcGIS Online, ArcGIS Enterprise, shout out CityEngine of course, I know, you know, they actually were the basis of one of my favourite animated movies, Zootopia. So CityEngine for sure. 

    Wayne: And Experience Builder. Don't forget. Experience Builder.  

    Ta: And Builder. Oh my gosh. Yeah. Experience Builder. GeoEvent Server, and if you know your purpose is situational awareness and monitoring and reporting, you know, Web App Builder, Dashboards, Survey123, QuickCapture, ArcGIS Urban, ArcGIS Indoors, you know, so many amazing tools. 

    And to help get you started with these tips and tricks, we've added all the resources that we've spoken about to our website. So that's GISDirectionspodcast.com au, including all the information that you'll need to get started with the four pillars of digital twins. 

    Now, we'd also love to hear any tips from you guys, so the ArcGIS community is very important to us. Please jump onto the website to send them through or connect with us on LinkedIn or Twitter or you know, wherever we are on soc. And hopefully we can feature some of those tips as part of our resources and ongoing program. 

    That's it for today. Happy mapping,  

    Wayne: Keep on twinning.  

    Mary: Stay spatial and we'll see you next time. 

    DISCLAIMER: The views and opinions expressed in this podcast are solely those of the hosts, and do not necessarily represent the views and opinions of Esri Australia. 

Subscribe to
Esri Australia news