Governments around the world depend on data to make clearer planning decisions. The power of GIS technology is helping the world visualise, understand, examine and analyse the data behind the sustainability targets set by the United Nations.
During the first week of May 2017, Esri in Redlands California, hosted staff of the United Nations Statistics Division along with international Esri Distributors and representatives from the National Statistics Offices of Ireland, Mexico, Philippines, Senegal and South Africa.
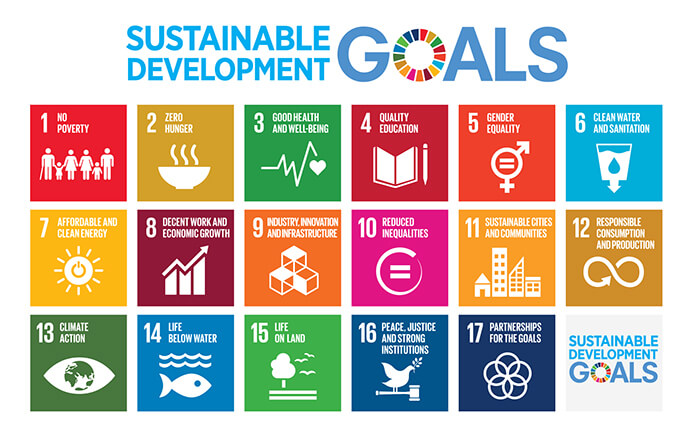
The purpose of the meeting was to demonstrate the power of a Geographical Information System (GIS) to visualise, explore, analyse and compare statistics relating to the United Nations Sustainable Development Goals (SDGs).
The SDGs are the universal plan of action agreed to by all United Nations member countries, including Australia, to shift the world onto a sustainable, resilient path by 2030.
Esri’s advanced GIS technology is central to accurately tracking and analysing the data behind crucial issues. Each of the goals is broken down into targets and indicators, with the National Statistics Office in each country responsible for collating the indicator-related statistics and sharing them with the United Nations Statistical Division. Previously, those numbers and spreadsheets were filed and rarely seen: a waste of data.
Esri is donating software and technical skills to bring much-needed clarity to the data, showing the progress, or not, of the SDGs.
Transparency is key to the success of the United Nations Sustainable Development Goals.
At first glance, you may believe that these goals are aimed at developing countries only. On the contrary; the SDGs are relevant to all nations. Citizens in developed countries may think that all is well, that governments look after things and individuals can’t play a role.
I spent almost 15 years working for the United Nations in Africa before returning to Australia to join the team at Esri Australia. With this experience, and time spent in the South Pacific, I learnt that our desires are universal. For example, being able to feed, clothe and educate our families, have guaranteed access to reliable health care, live safely and enjoy a stable environment. That is what parents the world over want. The power of GIS to analyse data doesn’t only transform lives in developing countries. It’s just as important to the developed world.
Only when you dig deeper into the layers can you reveal the hidden truth in data.
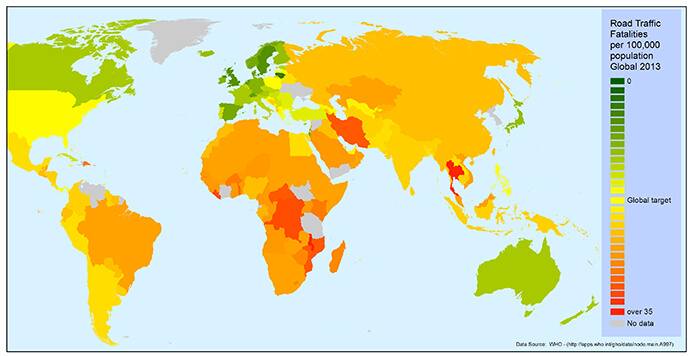
As an example let’s take a look at one indicator of the SGDs: 3.6.1 – Death rate due to traffic injuries. Traditionally this is expressed as a ratio per 100,000 people. Map 1, below, shows the global statistics for this indicator – the darker the green, the lower the fatalities. If you live in Australia, Canada, Cuba, Cyprus, Iceland, Israel, Japan or western Europe, the data suggests you can proudly claim to be ahead of the target. Or can you?
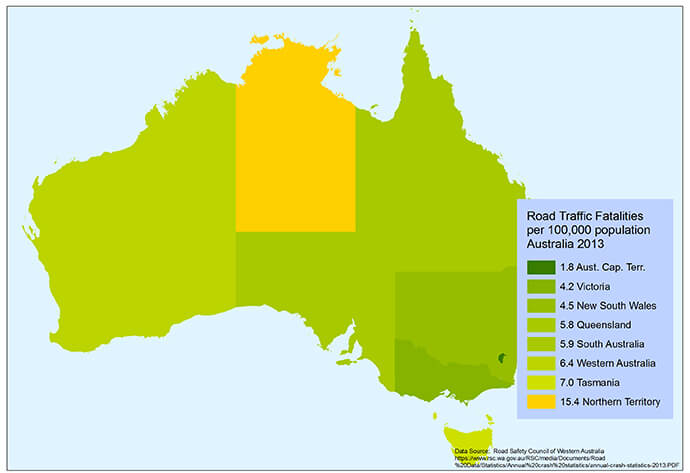
It's easy to arrive at generalised conclusions about populations, democracy and cultures. The following map delves a little deeper into the Australian statistics, which at second glance aren’t so clear cut.
It’s still easy to assign responsibility for these numbers to governments who build infrastructure and create road regulations. If you live in Western Australia, while the results look good, they don’t tell the whole story. Focusing a little closer shows that green does not appear uniformly across the state. Those earlier generalisations aren’t looking so sound any more.
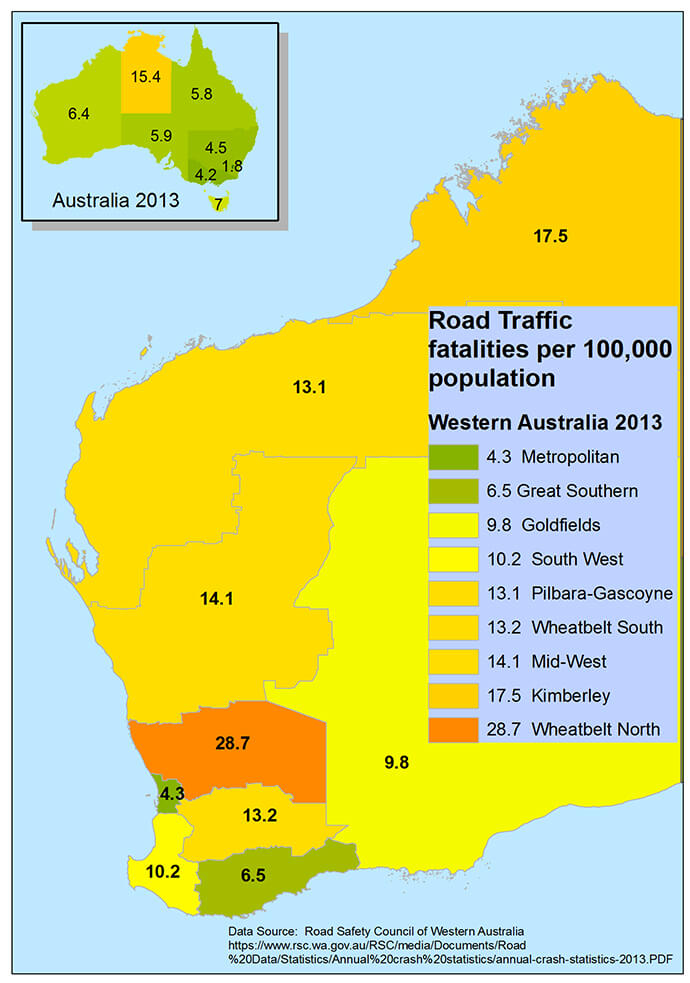
The question remains – what is acceptable? Even in those green pockets of ‘good’ statistics there are still fatalities that devastate families. The GIS enables further interrogation of those numbers to determine if factors like speed, alcohol or weather might contribute to that misery. The GIS allows authorities, and more importantly communities and individuals, to focus efforts and change attitudes about what is important in their local area.
So, are the United Nations SDGs just for the developing world? Not in the slightest. But what can you do to act locally? In terms of improving the ‘Death rate due to traffic injuries’ indicator, observing the road rules is a good start.
Governments can make the rules, but it’s the actions of individuals that will determine a positive outcome. Every individual has a role to play to influence the statistics and put their own mark on the map, changing the course of the future.
To find out more about how GIS can help governments achieve sustainable goals, call 1800 870 750 or send us an email.
References:
World data: https://www.who.int/data/gho
Australian state data: rsc.wa.gov.au/RSC/media/Documents/Road Data/Statistics/Annual crash statistics/annual-crash-statistics-2013.PDF