With close to 3,000 groundwater monitoring bores, WaterNSW is using ArcGIS to capture and analyse critical field data to enhance asset performance and maintain reliable service delivery to its customers.
WaterNSW is Australia’s largest water supplier and New South Wales’ major supplier of raw water.
Operating the state’s rivers and water supply systems, it supplies two-thirds of the water used in NSW to regional towns, irrigators, Sydney Water and local water utilities. It also owns and operates the largest surface and groundwater monitoring network in the southern hemisphere.
Groundwater monitoring involves a combination of automatic digital sensors and logging devices (telemetry) and manual sampling. Manually collected readings can be taken at intervals from daily to annually in accordance with various monitoring programs.
All the data from these activities is then collated within a central database system and is publicly available in real-time via the WaterNSW website.
As part of its Water Monitoring Asset Renewals Program, WaterNSW needed to assess the condition of the 3,000 groundwater monitoring bores it inherited when it was formed.
To optimise the manual data collection and analysis for this program, John Bickmore, Spatial Science Data Coordinator at WaterNSW, has developed a solution for groundwater monitoring assessments, using ArcGIS QuickCapture, Survey123 and Dashboards.
The groundwater monitoring assessment app and dashboard have been built in close consultation with field staff and managers, to ensure that the data being captured is relevant and will deliver useful insights back to the business.
This unique application has been implemented for groundwater bores but could be applied to any asset inspection workflow.
Streamlining asset inspections
When field workers are on site, ArcGIS QuickCapture is used as the launchpad to access everything they need.
From the QuickCapture app, users can quickly access the groundwater bore map, safety links, emergency contacts, and asset protection zone assessments.
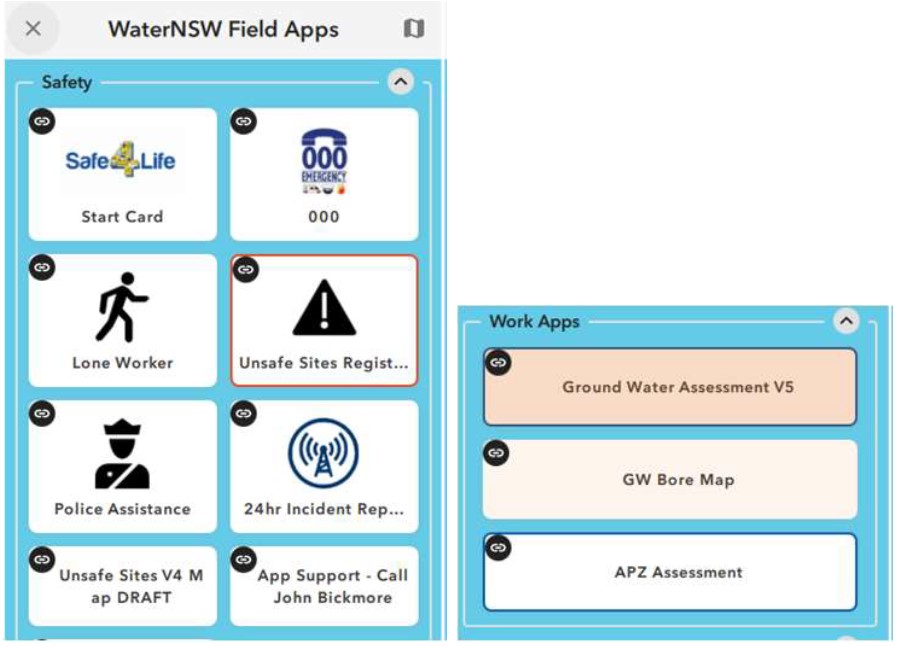
QuickCapture is a data collection app, but also comes with a web tool used to create QuickCapture projects.
The ArcGIS QuickCapture Designer tool enables the creation of projects that include buttons for the app experience as well as attributes for the data you want collected.
Configuration does not require any coding and updates can be pushed to field workers immediately.
Smarter data collection
The main tool used in the field is ArcGIS Survey123 - accessed directly or via the QuickCapture app - to capture data when assessing the groundwater bores.
Survey123 enables the creation of surveys with predefined questions that use logic and provide easy-to-fill answers, enabling field workers to capture more data, more accurately, in less time.
The Survey123 form used for the groundwater monitoring assessment has built-in validation and notifications and allows for the upload of photos, to ensure that data is recorded against the correct location.
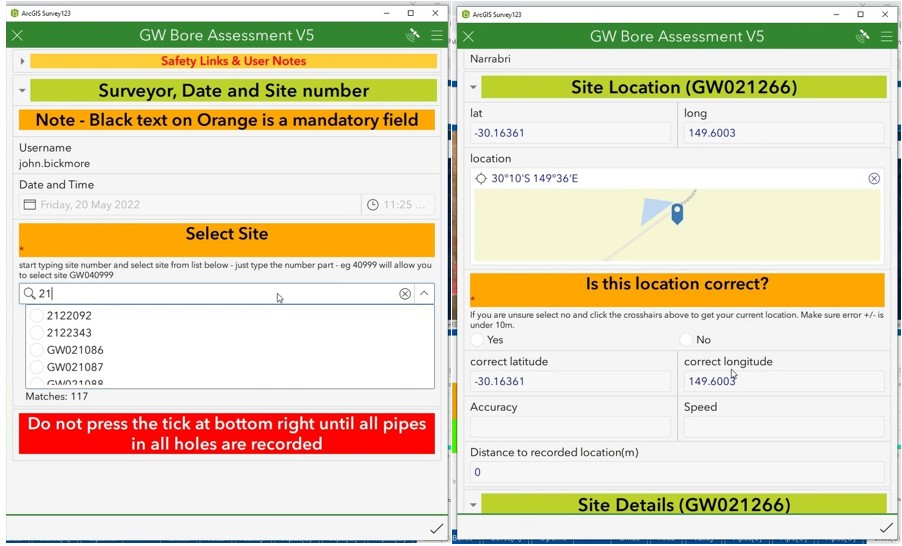
"We are building up a reliable dataset of where assets are located and how to access them, to save time and improve safety for future site visits." - John Bickmore,
Spatial Science Data Coordinator
Data is also collected on hole depth, phone signal strength and solar power potential, providing data to assess sites for telemetering and reduce the need for manual data collection in the future.
Turning data into actionable insights
All the data captured in Survey123 is securely submitted in real-time and integrated with ArcGIS, making it instantly available to managers in ArcGIS Dashboards for in-depth analysis.
The Groundwater Assessment Dashboard is setup to present analytics on the condition of the network and staff productivity, using intuitive and interactive data visualisations on a single screen.
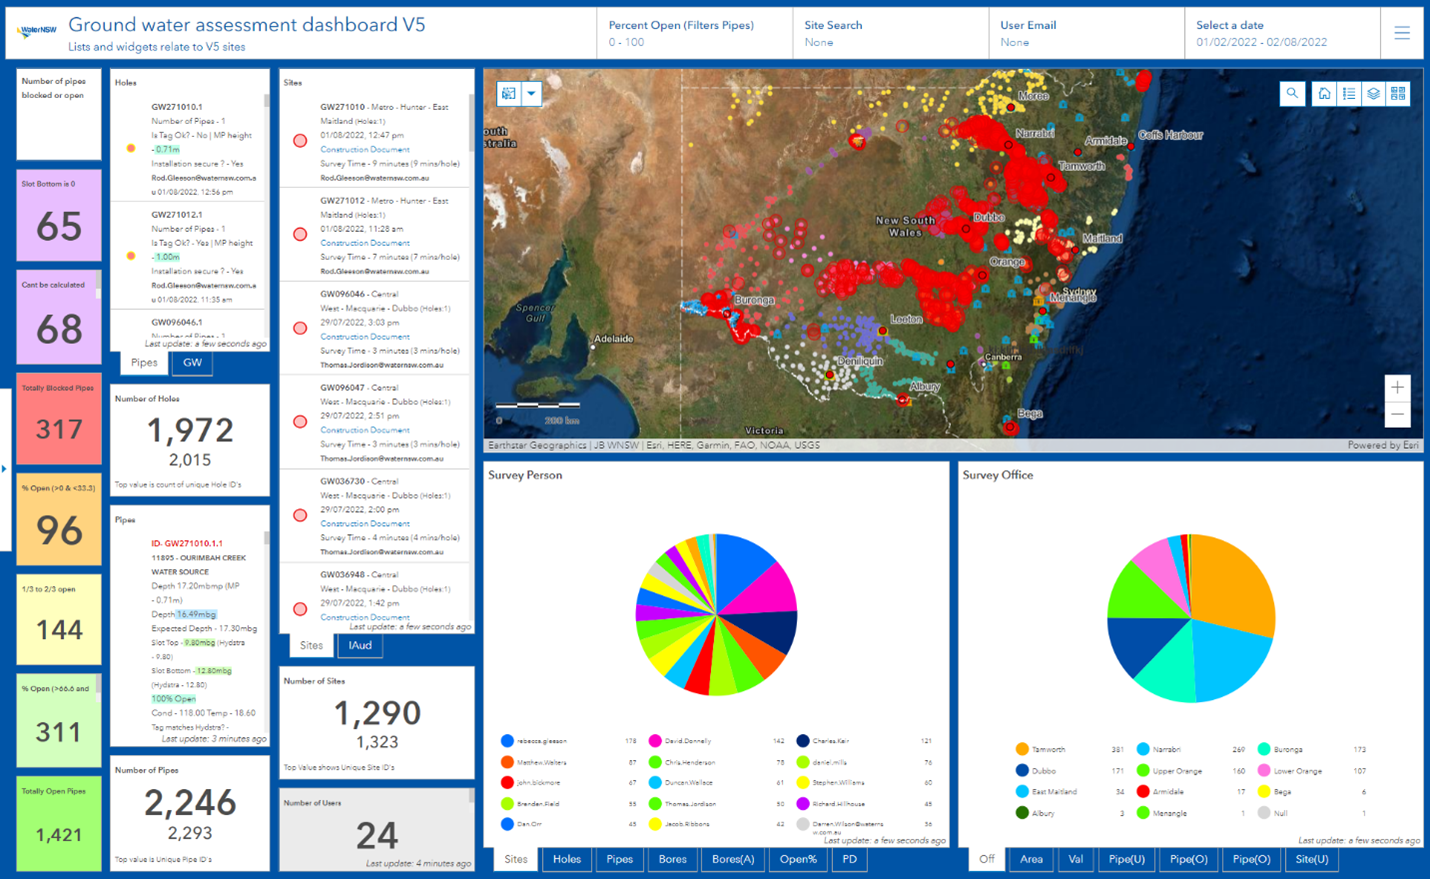
Field workers capture the start and end time of each survey, providing data to calculate the time spent at each site, and number of site visits per person, giving managers the ability to track productivity against performance metrics.
These insights enable managers to make more informed decisions based on risk and safety factors, such as prioritising sending contractors to bores that are completely blocked.
Operational dashboards like this can be used to help operations staff understand any type of assets, events, or projects, by monitoring their status in real time.
Dashboards can be shared and viewed within the organisation, with specific groups, or publicly. Esri’s suite of field applications enable the streamlining of data collection with flexible mobile applications to support critical operational workflows and create a more resilient system.
ArcGIS makes it easy to share this information using web maps, dashboards, or mobile apps, to provide immediate awareness to stakeholders, and provides analytics and tools to gain previously hidden insights.
To learn how you can optimise your asset inspection workflows, from field operations to real-time insights, contact us to speak to a product specialist.
ArcGIS QuickCapture
Rapid data collection in the field
Learn more
ArcGIS Survey123
Smart forms for data collection
Learn more
ArcGIS Dashboards
Analytics at a glance
Learn more