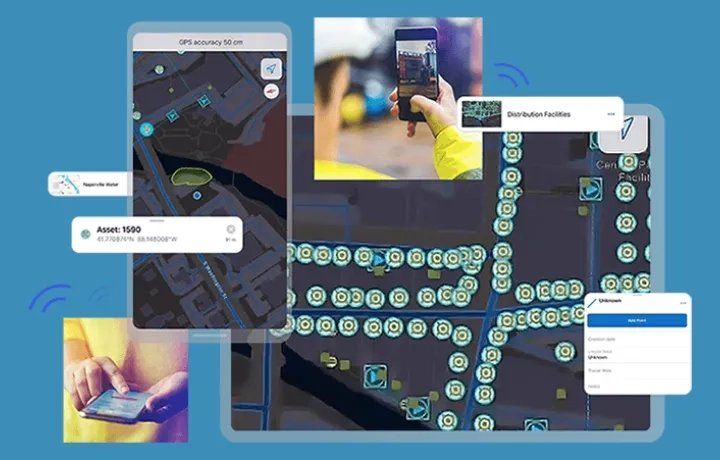
Real-time GIS enables water utilities to analyse live data from sensors and devices as they come in, trigger automatic alerts, detect critical events and monitor performance thresholds to enhance safety, streamline operations and ensure informed actionable decisions.

Smart water meters
Reduce water waste, recover revenue, and analyse consumption data.

Water quality sensors
Visualise and analyse water quality data to discover trends and patterns.
Leak detectors
Receive alerts when there's a leak and know where it is straight away.
Flow meters
Monitor systems to identify and reduce water loss.
SCADA system
Expand access to SCADA data with a map centric approach.
Bring your IoT to life
Create location intelligence with different apps to see a real-time view of your water utility.
All data, all the time
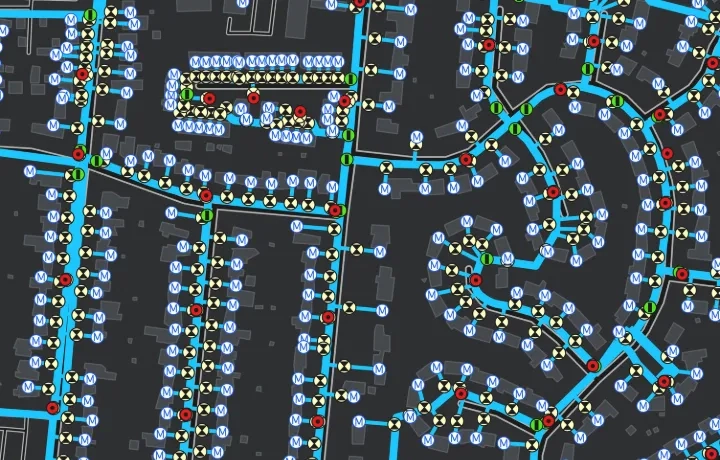
Leverage configurable inputs for any kind of water utilities related data. ArcGIS GeoEvent Server can receive and interpret events from any data stream, including stationary sensors such as water quality monitors, stream gauges, and tide stations; moving assets like research vessels; or events like flood alerts and incidents.
Real-time analysis
Process and filter data as it's received, including filtering for specific attributes in high-velocity and high-volume data. Determine spatial relationships of events with an established geofence such as a point, line or polygon.
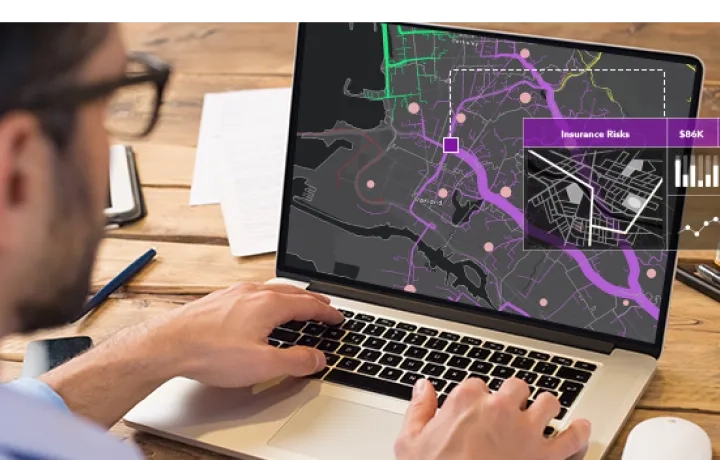
Big data analysis
Real-time data generates large volumes of information for water utilities. ArcGIS GeoAnalytics Server processes this data, enabling leak detection, tracking of water usage and pressure, and monitoring of service crew routes. It integrates seamlessly with external data sources like Amazon S3 and Microsoft Azure Blob, giving water utilities a comprehensive view of their operations.
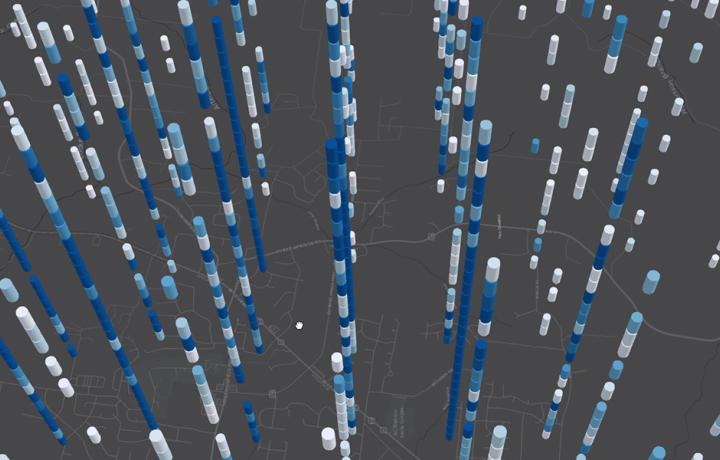
On-the-fly aggregation
ArcGIS GeoEvent Server receives and analyses events from a variety of data streams. Configure inputs from stationary sensors like water quality and pressure monitors, track assets like maintenance vehicles, and capture events like pipeline breaks or sewer overflows.
Operational dashboards
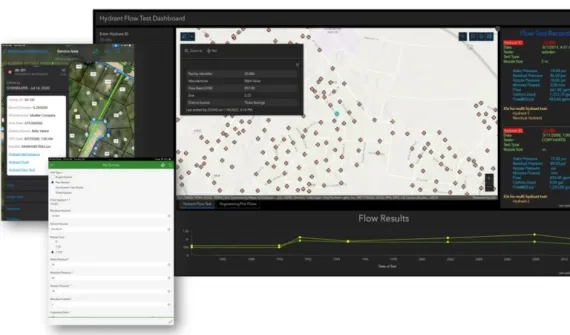
Visualise IoT data on a dynamic dashboard with charts, gauges, maps and other visual elements that show the status and performance of vital assets and events in real time. ArcGIS Dashboards for can deliver a complete operating picture of your real-time, big data.
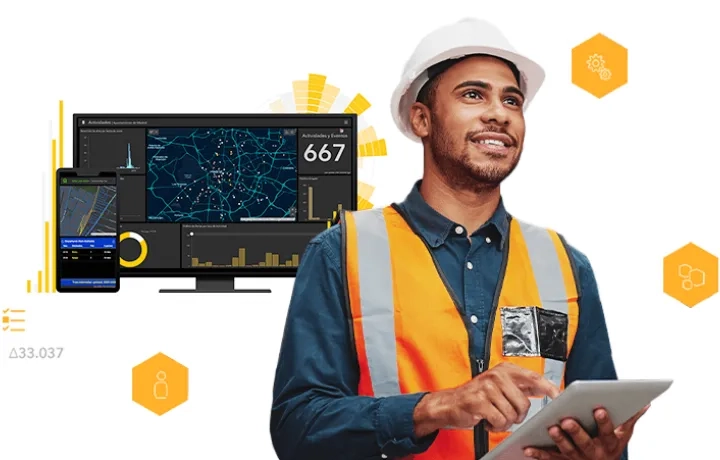
Notifications
Control how you want to disseminate the data by configuring outputs in the format you want. Whether by email or text message, you decide how an alert is sent to stakeholders.
Share information
Store and share observations and analysis. Make the data accessible for visualisation, understanding, and improved decision-making. Control who and how much you share with users and groups.
