In an Australian television first, Seven News have armed their presenters and reporters with military-grade mapping technology for Saturday's live election broadcast.
The interactive 2013 Federal Election Map will enable Seven’s news team to conduct live demographic and Twitter analysis to reveal the key issues among voters and provide unprecedented insights into each seat as counting takes place.
The map employs the same Geographic Information System (GIS) technology used by Australia’s defence forces to understand international socio-cultural situations, and the same technology global emergency services groups use to respond to large-scale disasters, including the Oklahoma twister, Japan tsunami and Brisbane floods.
Seven News and Yahoo!7 partnered with GIS technology giants Esri Australia to develop the map.
Esri Australia GIS in media specialist Alicia Kouparitsas said the election map would provide a powerful real-time geographic context to election results in a way previously not possible.
“This election is the first in which Twitter will play an integral part of election night analysis, rather than just being included for entertainment’s sake,” Ms Kouparitsas said.
“Voters’ geo-located tweets will be mapped and analysed against a broad range of demographic data, to help Seven News determine where and why trending topics are emerging.
“In this way, the map provides a highly detailed perspective of each electorate to reveal how campaign issues, such as asylum seeker treatment and paid maternity leave, may affect the vote.”
GIS technology is already a key tool for global news giants such as the BBC and CNN in the United States, however it is the first time an Australian broadcaster has used the technology to create a live on-air research tool.
Seven News Election Producer Stuart Wallace said on election night, presenter Matt White will access the map via a giant interactive touchscreen to investigate individual electorates and examine big election issues such as cost of living.
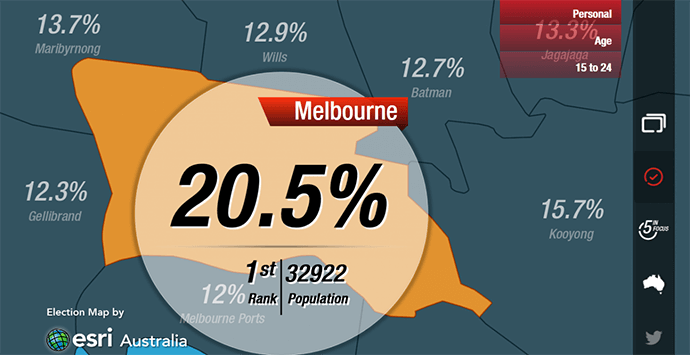
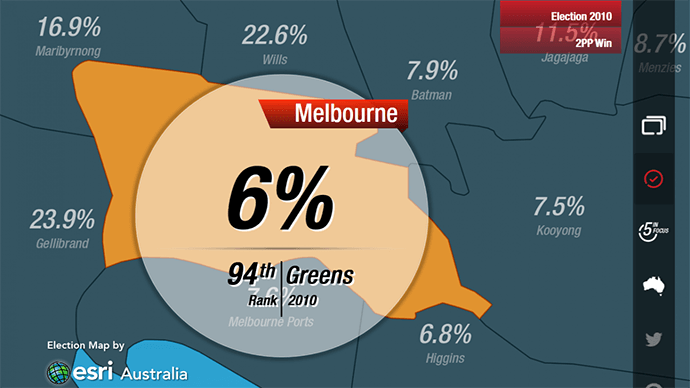
“The election map enables us to focus on an electorate and instantly determine the percentage of single-parent families that live there, the level of mortgage stress experienced by voters, or the average income – to provide a greater context to what’s unfolding in the tally room,” Mr Wallace said.
“The map contains a comprehensive collection of critical information about every federal electorate in Australia, so we can delve further into what’s influencing voters, such as education, infrastructure, ancestry and employment.”
Ms Kouparitsas said Seven’s election broadcast is supported by an online version of the map that enables viewers to investigate their own electorates in greater detail.
“The online election map puts key information at your fingertips in the incredibly user-friendly format of an interactive map – so you are literally just one click away from accessing the same level of detailed analysis you’re watching on television,” Ms Kouparitsas said.
“There are some really useful features such as the ‘5 in Focus’ tool, which highlights the five highest and lowest ranked electorates according to a variety of criteria.
“This means if you want to find where in Australia house prices have increased the most since the last election, or locate the electorates with the lowest family incomes, you can uncover this information in seconds.”
The demographic data used in the 2013 Federal Election Map has been sourced from the Australian Bureau of Statistics and the Australian Electoral Commission. Hometrack data – which reveals detailed information about the Australian property market – was sourced from MapData Services.
If you would like to connect with our public relations team, submit a media enquiry.