Disasters – from bushfires to floods – are both cyclic and endemic in Australia. Yet the risks and impacts are not evenly distributed. Post-disaster research shows that individuals – even within the same location – experience disasters differently.
Throughout the disaster response cycle, governments and communities are often focused on the physical landscape – from the location of encroaching vegetation to areas of flood-prone land.
Yet factors heightening an individual’s exposure to disaster risks – such as age, income and living situation – are often overlooked. Mapping social vulnerability factors is critical to preventing suffering, improving economic outcomes and strengthening community resilience – well before a disaster strikes. So which factors impact the disaster management cycle in unexpected ways? Here are five common examples:
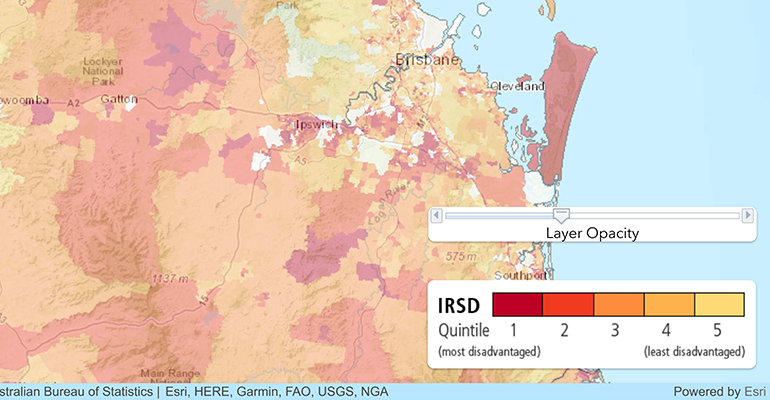
1. Income and poverty
Individuals experiencing poverty may struggle throughout the entire disaster cycle: preparedness may be too expensive, and evacuation is difficult without proper access to transportation. In the aftermath of a disaster, individuals with lower disposable income may also struggle to secure appropriate accommodation. Overall, these groups require additional support throughout the disaster lifecycle.
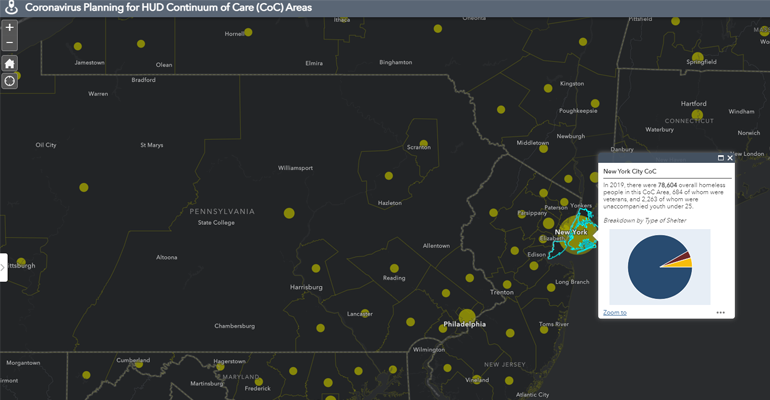
2. Living situation
People experiencing homelessness are more susceptible to the extremes of a natural disaster. An analysis of transient and homeless populations provides governments with the ability to forecast demand and optimise allocation of resources.
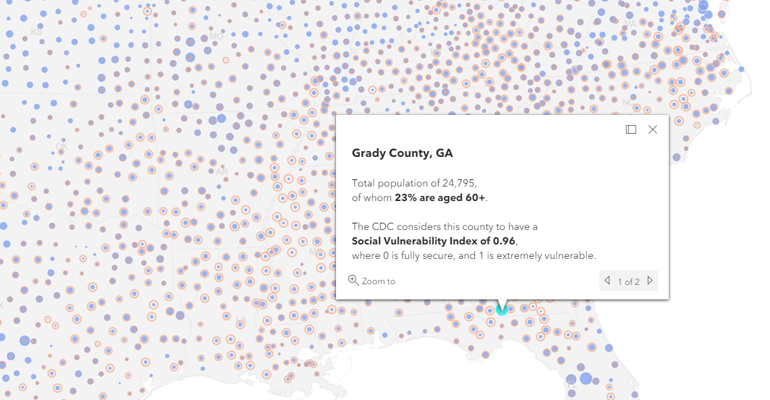
3. Age
The young and old are disproportionately affected by disasters, with effects compounding for parents and carers, who are responsible for both their own and others’ welfare. When examining COVID-19 risk, spatial analysis identified four counties in the United States with more than a third of their population aged 60+, a very high Vulnerability Index of .75 or more, and a population of at least 100,000 – helping authorities assess a potential increase in demand on the existing medical infrastructure.
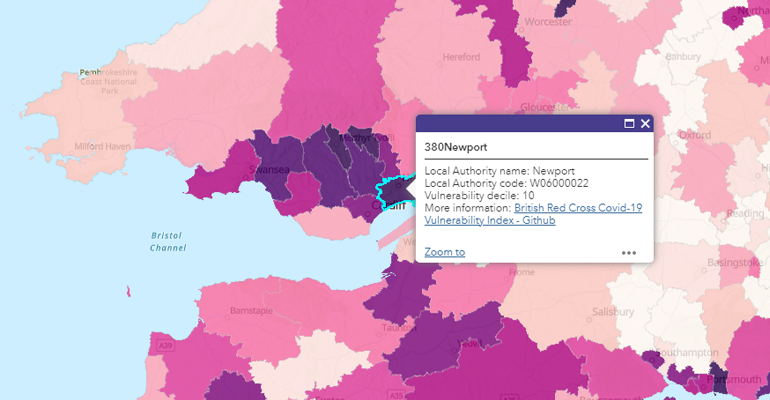
4. Disability
Disasters may reduce access to support services – pushing people living with a disability into a status of higher vulnerability. The British Red Cross’s COVID-19 Vulnerability Index identifies areas in the UK where people might be more vulnerable to the effects of COVID-19. The Index looks at clinical vulnerability, wider health and wellbeing and socioeconomic vulnerability. Underlying data sources include people receiving disability benefits and the standardised ratio of people with a long-term health problem or disability.
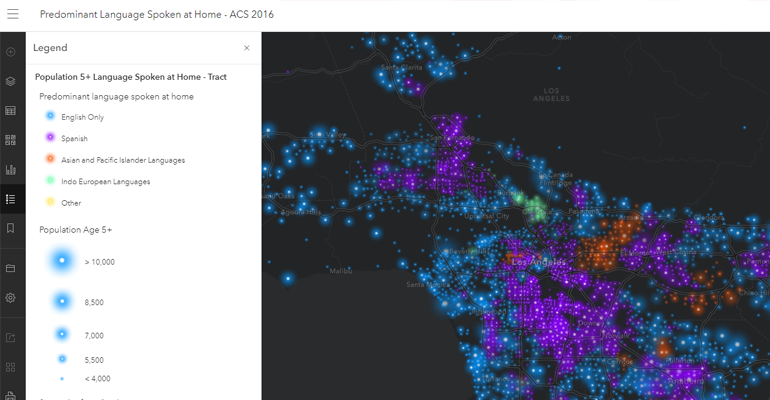
5. Culturally and Linguistically Diverse (CALD) status
For populations where English is a second language, warnings may not be fully understood or contextualised. This may be particularly true for first-generation migrants – who often rely on family or social services for this support. The key takeaway: Governments must identify areas where CALD populations reside to improve on-the-ground communication initiatives for emergency and disaster response.
A broader perspective on community resilience
Populations with high social vulnerability are susceptible to small and large disaster events. A lack of infrastructure or formalised response may place the burden on charities and other non-governmental organisations. For more, please read this great piece by Fidelis Magalhães: Lessons from the recent cyclone in Timor-Leste.
Key takeaways
What can be done? Just as we prepare for the physical precursors of a disaster – from flood prone roads to encroaching vegetation, equally we must take into consideration how different sub-groups will be affected.
To this end, organisations must develop detailed information on a Topology of Vulnerability to guide their planning and response postures. There is some great work underway already: recently I heard from Queensland Fire and Rescue on their development of a Disaster Vulnerability Index.
Looking at needs geographically helps provide a scientific approach to disaster management. By mapping vulnerability factors throughout the disaster management cycle – from preparation through to recovery – we can begin to identify and reduce the danger to at-risk populations and strengthen community resilience.
Interested in the role of GIS in disaster management? If this is an area you’re working on, let’s connect.
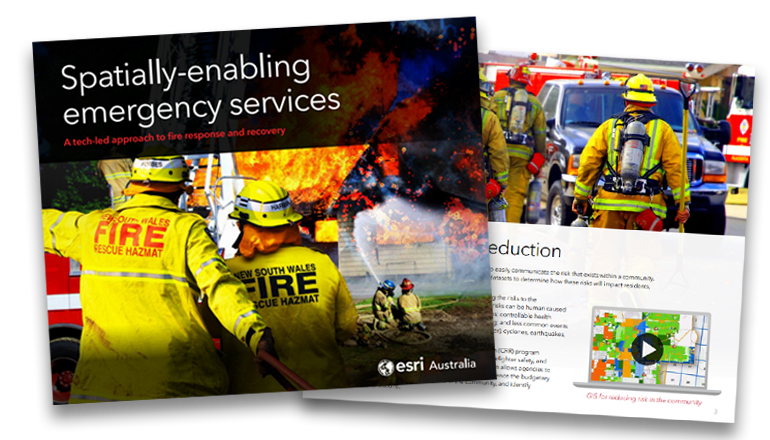
Download the e-book: Spatially-enabling emergency services