A powerful, next-generation desktop GIS, ArcGIS Pro is feature-packed and developed with enhancements and ideas from users. ArcGIS Pro supports data visualisation, advanced analysis, and authoritative data maintenance in 2D, 3D, and 4D. Supporting data sharing across a suite of ArcGIS products such as ArcGIS Online and ArcGIS Enterprise, users can work across the ArcGIS system through Web GIS.
Learn how to migrate from ArcMap to ArcGIS Pro
How ArcGIS Pro works
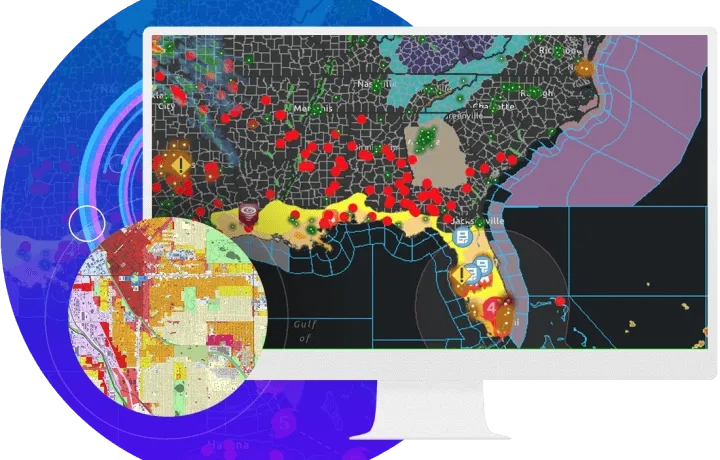
Integrate data from multiple sources
Combine data from various sources and formats. ArcGIS Pro supports industry and community standards to ensure inclusion of any dataset you have.
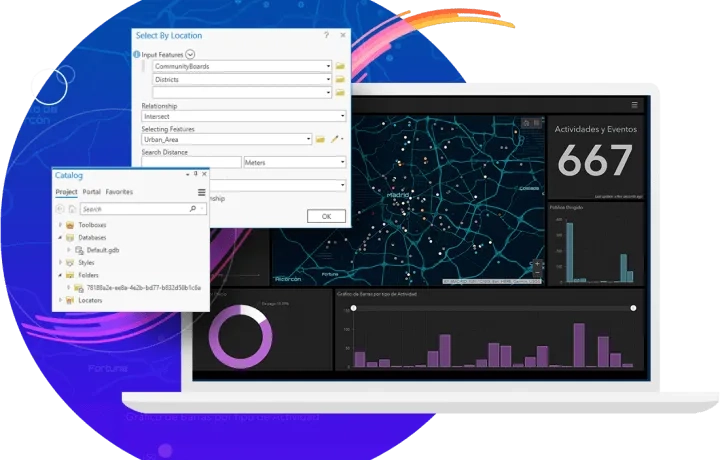
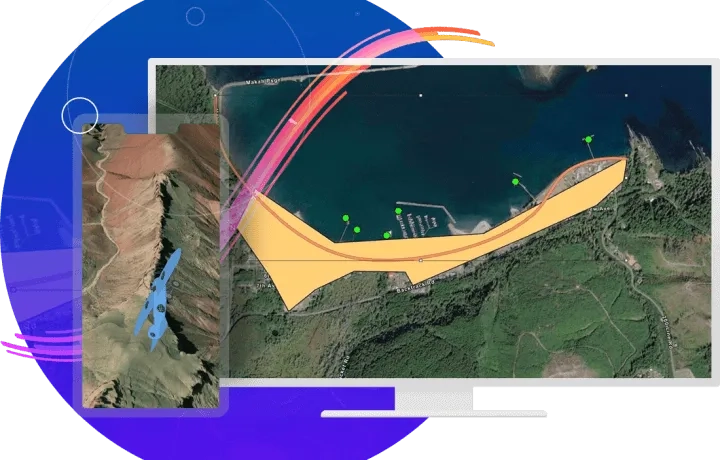
Visualise your data
Display data in 2D and 3D simultaneously. Manage multiple maps and layouts in a single project-based workflow.
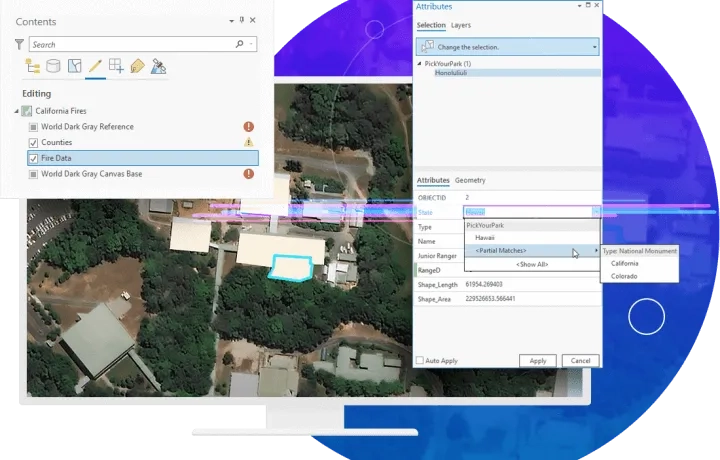
Edit and analyse your data
Simplify data editing and analysis with context-sensitive tools. Perform interactive 2D and 3D analysis. Automate work with ModelBuilder or Python.
Share your work with the world
Publish maps and analysis results as web services or high-quality prints. Share maps and data on ArcGIS Online, ArcGIS Enterprise, or as a package.
Ready to learn more? Contact us to speak to a product specialist.
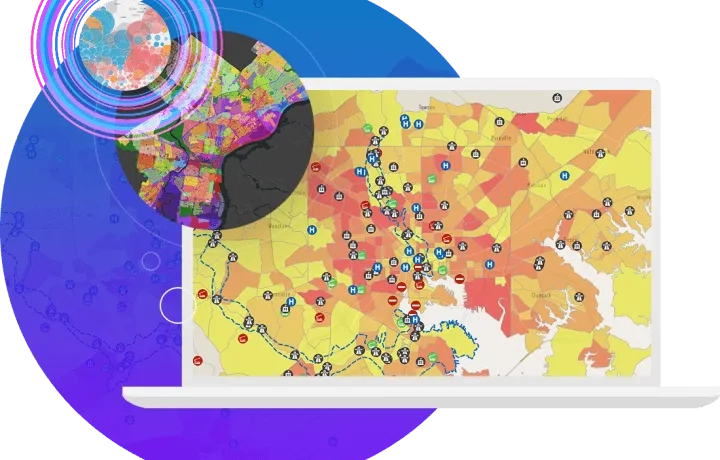
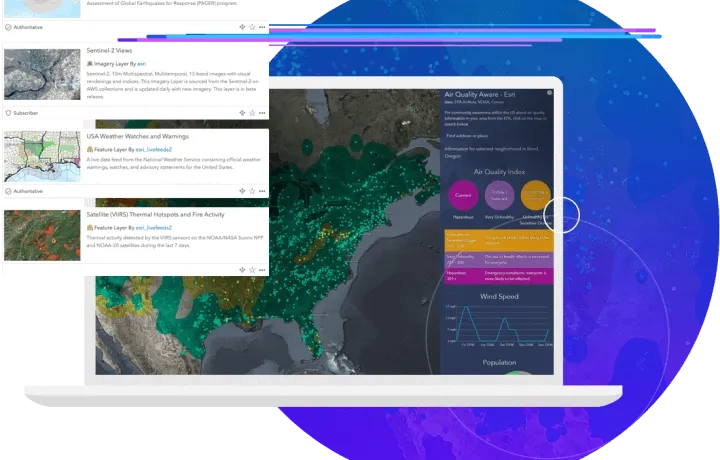
Transform data into actionable insights
Combine multiple data sources to make maps that are as smart as they are beautiful. Use scientific analytical tools on 2D, 3D, and 4D data to identify patterns, make predictions, and answer questions. Quickly share projects and information within your organisation, online, and through mobile apps.
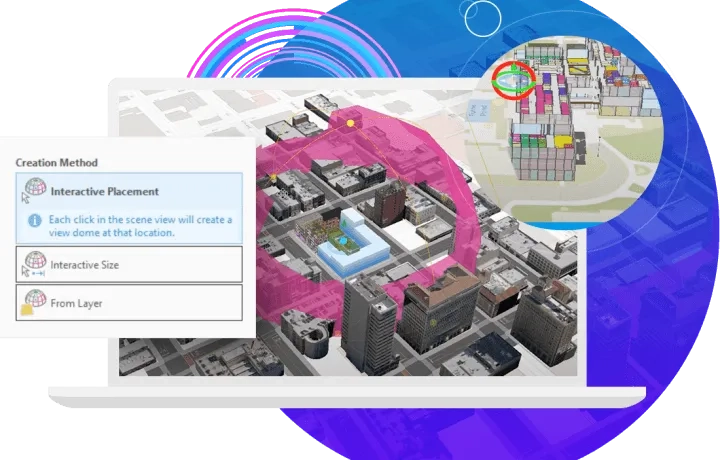
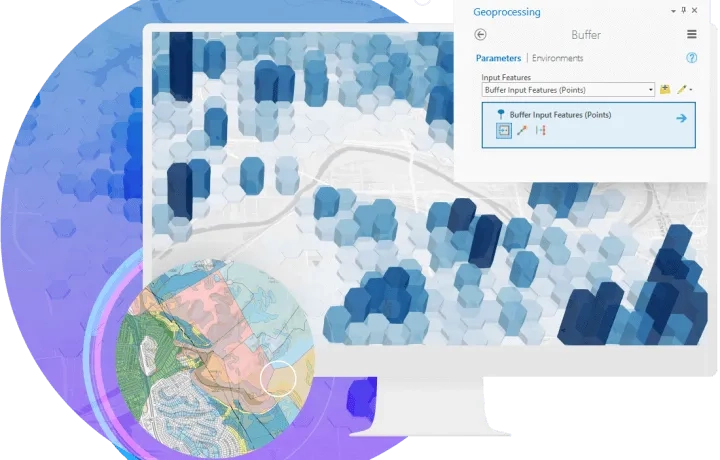
Exploration and visualisation
Using 3D exploratory analysis, investigate your data by interactively creating graphics and editing analysis parameters on-the-fly. Interactive tools help you to create analytical objects by clicking on the scene or using input source layers. Manipulate analysis parameters and receive real-time visual feedback.
Creating graphics
Graphic elements can be simple geometric shapes—rectangles, circles, lines, or points—or they can be complex polygons, linear or curved text, or images. When a graphics layer is added to a map in ArcGIS Pro, you can create graphic elements in maps and draw them in layout map frames and scenes.

Exploratory analysis
Using exploratory data analysis tools—like Line of Sight, View Dome, and Viewshed—in 3D, you can investigate your data by interactively creating graphics and editing analysis parameters in real time.
Interactive tools
With the interactive tools, you can create analytical objects by clicking in the scene or using input source layers. You can manipulate analysis parameters and receive real-time visual feedback in the scene.
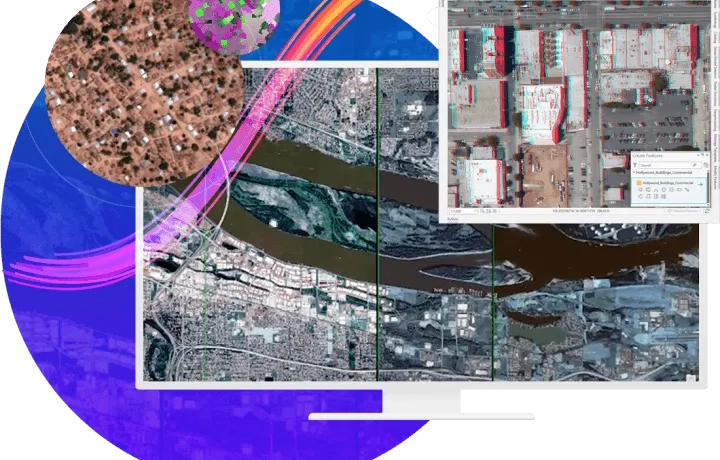
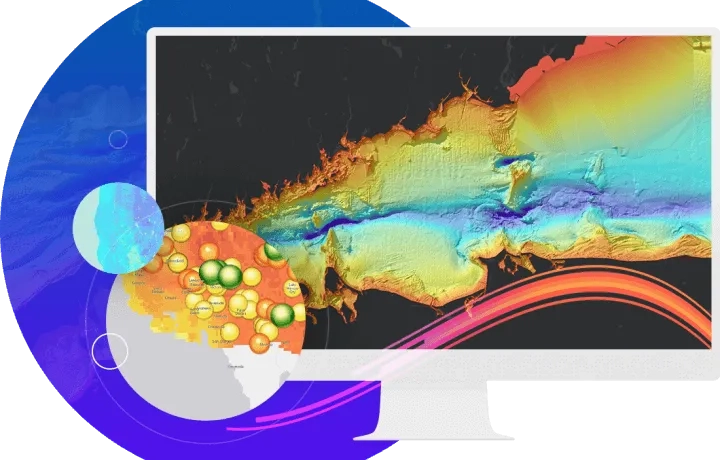
Imagery
ArcGIS Pro provides a collection of powerful tools to manage and analyse large collections of imagery such as drones, satellites, lidar and more.
Analyse imagery
ArcGIS Pro has the tools you need to understand and find patterns in imagery from a wide range of sources. Analyse imagery data while performing feature extractions, scientific analysis, and temporal analysis to explore changes over time, and more.
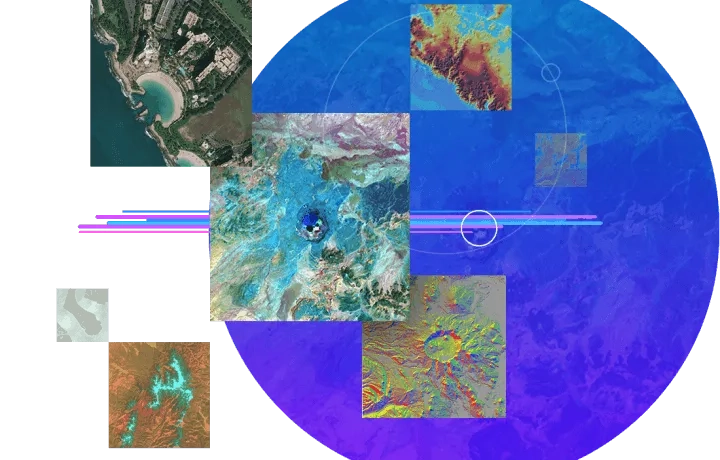
Manage imagery
Manage imagery from a wide variety of sources—satellites, drones, unmanned aerial systems, full-motion video, elevation, lidar, and more. ArcGIS Pro provides extensive enterprise image management capabilities and is used by organisations in a wide range of industries to manage their imagery holdings. This makes assets accessible and turns them into useful information products for both data visualisation and analysis.
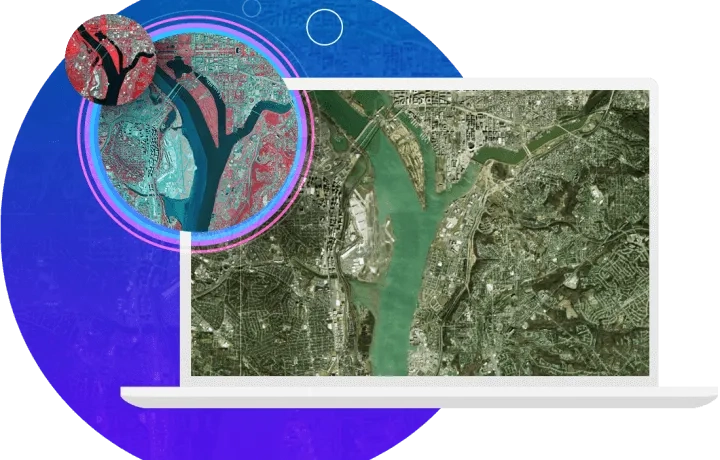
Process imagery
The on-the-fly processing provided by ArcGIS Pro prevents data duplication and reduces the amount of imagery to store. Use dynamic mosaicking to update and process new imagery, including orthorectification, pan sharpening, rendering, enhancement, filtering, and map algebra capabilities.
Data management
Ensure data integrity with a complete set of tools for storing, editing, and managing various forms of spatial data—including big and real-time data.
Store data
Store and access your data in ArcGIS, using flexible methods that fit your workflows. Use the cloud, common file formats, or the geodatabase (Esri's method for storing and managing geospatial data). When work needs to be recovered, unsaved changes such as maps, scenes, layouts, reports, tasks, and locators are recovered up to the time of the most recent backup. The backup project seamlessly replaces the original, and a new backup project is created and stored in your project home folder, in a folder named .backups.
Edit data
ArcGIS Pro provides all the tools you need to manage your geospatial data in single-user and multiuser editing environments. Simplify editing and ensure data integrity with context-sensitive editing tools, industry-focused templates, and domains and subtypes. Create keyboard shortcuts to help enable editing, or turn off editing completely inside ArcGIS Pro to prevent unintentional edits.
Evaluate and validate data
ArcGIS Pro contains a complete set of tools for checking and validating data integrity. Tools that scan the accuracy of spatial relationships, connectivity, and attribution are consistently running. Validation toolsets scan third-party files and run selected data repair processes to evaluate the data and ensure high quality.
Customise and create maps and data
Reimagine ArcGIS Pro with add-ins and configurations developed with the ArcGIS Pro SDK for .NET. Create, customise, and perfect your ideal ArcGIS Pro environment.
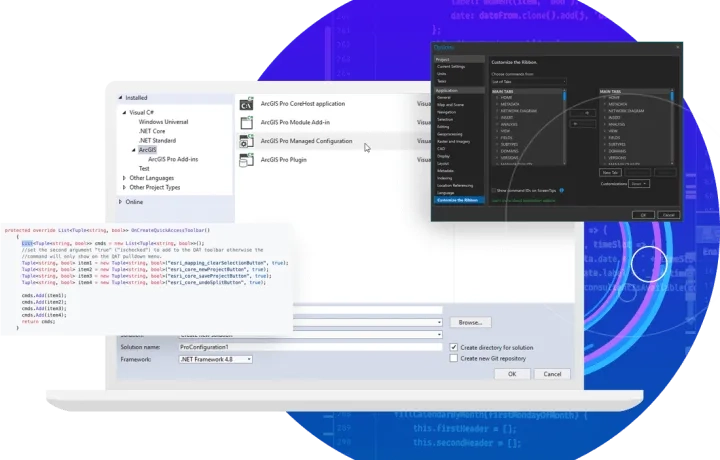
Add-ins
With ArcGIS Pro SDK for the Microsoft .NET Framework, you can extend ArcGIS Pro with your own unique tools and workflows. Build ArcGIS Pro add-ins and solution configurations using Microsoft Visual Studio and ArcGIS Pro SDK for .NET that provide your users with custom functionality specific to their organisation or industry. Add-ins can be developed and tailored for your specific users' needs, such as providing a new set of ArcGIS Pro tools that streamline a complex editing workflow.

Configurations
Along with having all the capabilities of an ArcGIS Pro add-in, solution configurations give you the ability to customise the startup user interface (UI) for ArcGIS Pro. You can create a custom splash screen, a home page, and an About page, and use conditional logic and user roles to tailor the overall user experience. Customise ArcGIS Pro with your own custom branding, startup experience, and streamlined UI.
Get started
Access online resources with concept and guide documentation, API references, labs, community samples, and more. Create an ArcGIS Pro add-in using ArcGIS Pro SDK for the Microsoft .NET Framework. Then set up feature attribute values and start developing add-ins and solution configurations to create a custom UI for ArcGIS Pro and a tailored user experience for your organisation.
ArcGIS Marketplace
ArcGIS Marketplace enables organisations to market and distribute ArcGIS Pro add-ins and ArcGIS Web AppBuilder widgets directly from the Marketplace site. This new capability allows users to create informative product listings from which they deploy their products. ArcGIS Pro add-in developers can now create listings to distribute and market their add-ins, allowing users to try, purchase, and download them.

Cartography and design
Easily and accurately add your customised data to meet today's cartographic and design standards. Compile your data with just a few clicks and bring your projects into Adobe Illustrator with the new AIX export capability. ArcGIS Pro’s deep symbology tools, performant rendering, and vast support of geospatial formats merges the domains of analysis and presentation. Take your projects further and tell the story you’ve always envisioned.
Design beautiful maps
ArcGIS Pro offers a massive set of geoprocessing and analytical tools for mapmakers, but the visualisation capabilities that help communicate analysis are equally impressive. The 2D and 3D realms, deep thematic resources, intelligent labeling engine, vast layout and export options, and almost countless custom symbol creation tools are just some of the features that will inspire and enable the maker within each mapmaker.
Cartography toolbox
The Cartography toolbox is designed to produce and refine data to support the production of maps. This includes the creation of maps, the simplification and aggregation of features, and the reduction of their density. Tools for the creation of a map series are also included.
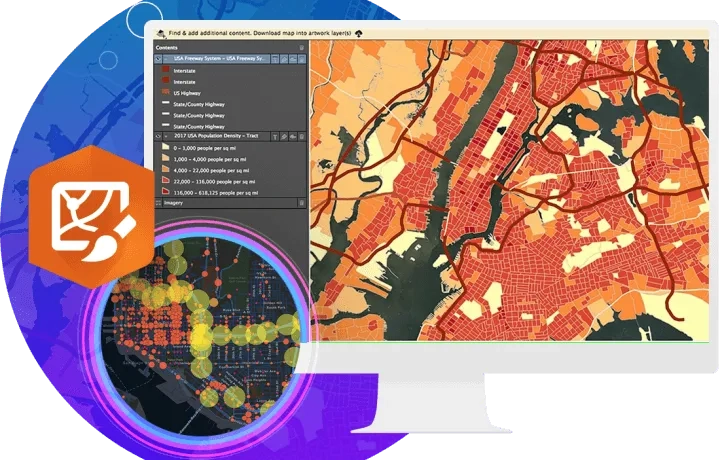
Adobe Illustrator export
Oftentimes, mapmakers are looking to enhance their GIS-made map products using a graphic software like Adobe Illustrator. For these users, the Adobe Illustrator Exchange (AIX) export format in ArcGIS Pro provides a seamless pathway to convert map data into graphic artwork for further aesthetic design. ArcGIS Maps for Adobe Creative Cloud, Esri's ArcGIS plug-in for Illustrator, converts raster and vector data from an AIX file into an organised and ready-to-design Illustrator file. This new workflow gives designers the creative freedom to enhance their maps' appearance without risking alteration of data stored in their GIS, which also makes it a powerful collaboration tool.
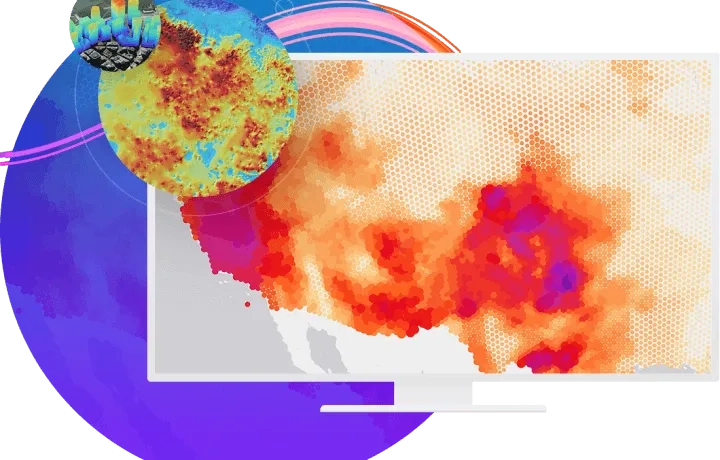
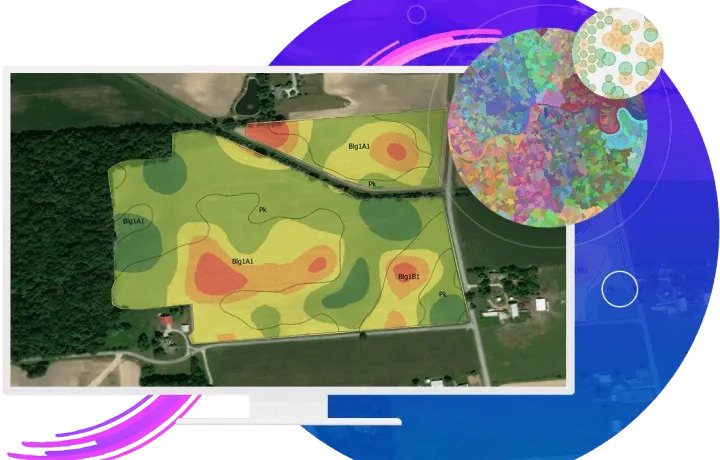
Analytics and data science
Understand the world around you. Use scientific analytical tools on 2D, 3D, and 4D data to identify patterns, make predictions, and answer questions.
Determine the where
Simply getting your data onto a map puts it into context, reveals new insights, and enables greater understanding. Solve complex location-oriented problems, find patterns, assess trends, and make decisions. Go beyond mapping by studying the characteristics of places and the relationships among them. Discover new perspectives to help with your decision-making.
Understand spatial relationships
The answers to many questions often require an understanding of spatial relationships such as proximity, coincidence, intersection, overlap, visibility, and accessibility. Analyse various data layers to calculate the suitability of a place for a particular activity and detect change over time. Use the analysis and geoprocessing capabilities in ArcGIS Pro to answer many spatial questions while performing spatial analysis.
Identify locations and routes
Use GIS for site selection based on empirical data. Optimise routing by including your own custom network data (private roads) and restrictions for weight, turns, or cargo. Define areas that have a particular set of characteristics—the locations that meet your criteria can be retained; those that do not can be eliminated from further analysis.

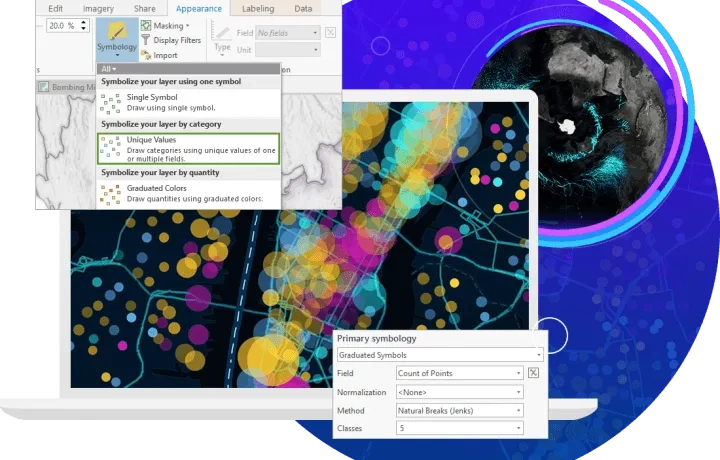
Detect patterns
Find hot spots and outliers or natural data clusters when you use data to detect, quantify, and analyse changes in patterns over time. Spatial clustering may indicate patterns of underlying processes because similar processes often follow similar locating patterns. Determine the appropriate analysis methods and reach reasonable conclusions from your analysis.

Predict
Spatial analysis lets you use powerful modelling techniques to make predictions and better understand our world. Gain a clear understanding of the objectives of your study and see how the predicted values (and other associated information) help you make more informed decisions when choosing a method within ArcGIS Pro.
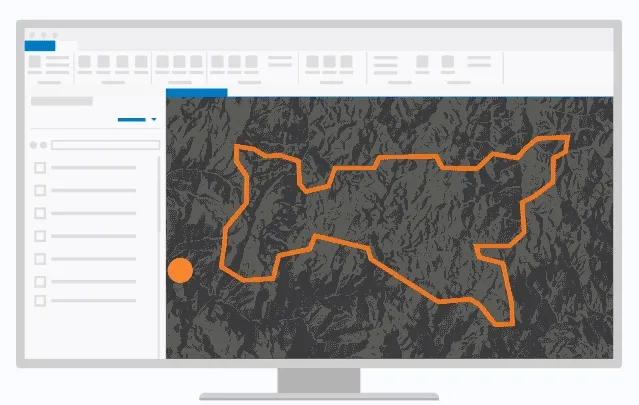
Share your work
Quickly author and discover content and web maps all within ArcGIS Pro. Discover created work from within your organisation or worldwide from the ArcGIS user community. Seamlessly access ArcGIS Living Atlas of the World content and share your work throughout the Geospatial Cloud.
Author
Author your map with existing web layers or with data layers that are shared as web layers when you share your web map in ArcGIS Pro.
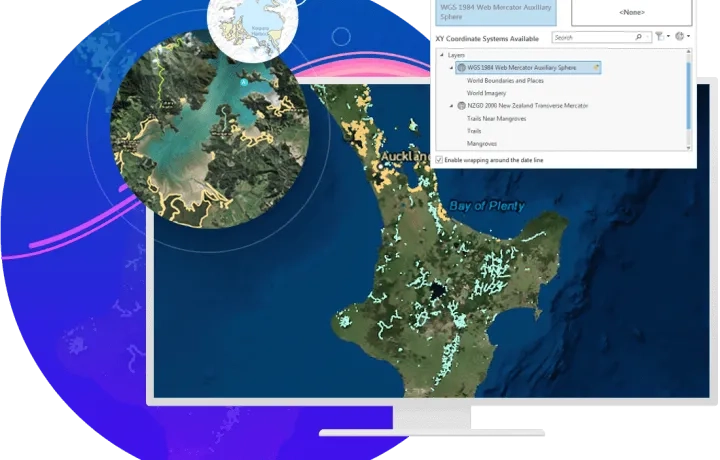
Discover
Enhance your maps with ArcGIS Living Atlas of the World, the foremost collection of geographic information from around the globe. Access basemaps and integrate data from authoritative sources.
Launch new capabilities
Discover Voxel layers, a 3D volumetric layer to visually analyse and explore your complex multidimensional data. Manage your 3D and 4D parcel data, run analysis with Trace networks, Python Notebooks, Geodatabase replication workflows and so much more. Add your work from ArcGIS Pro to Adobe Illustrator to finalise your design project.
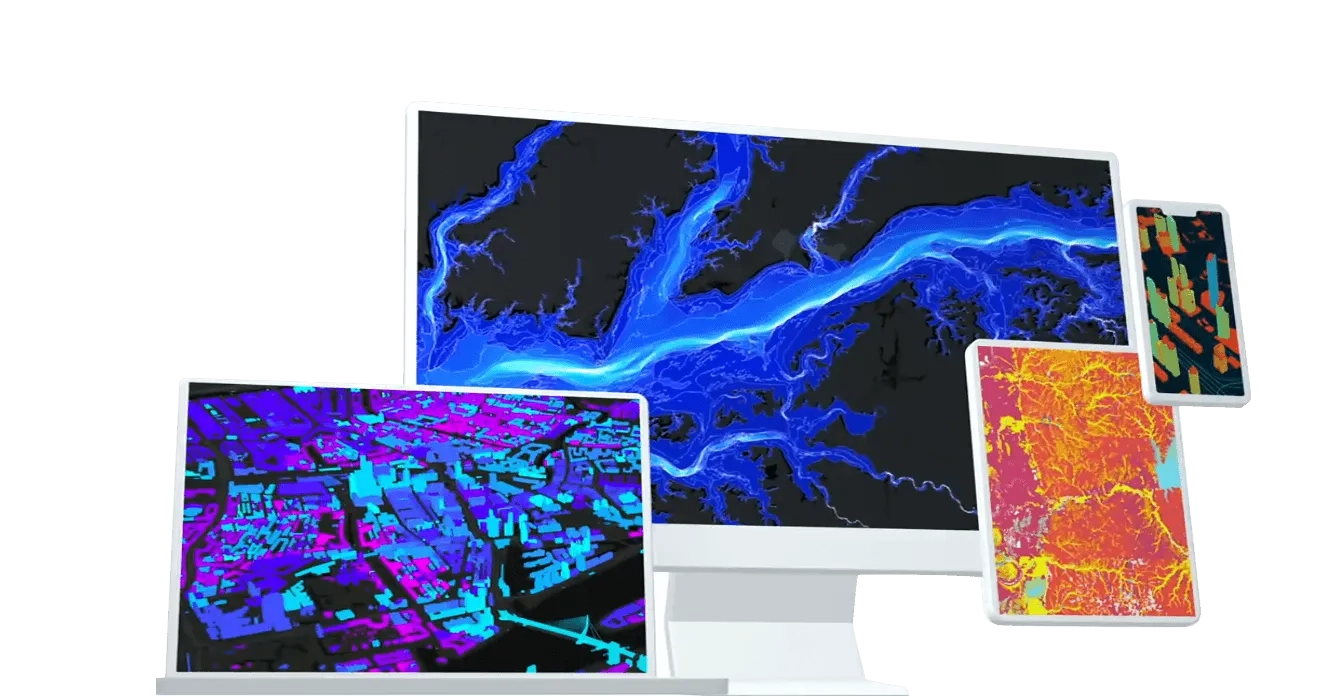
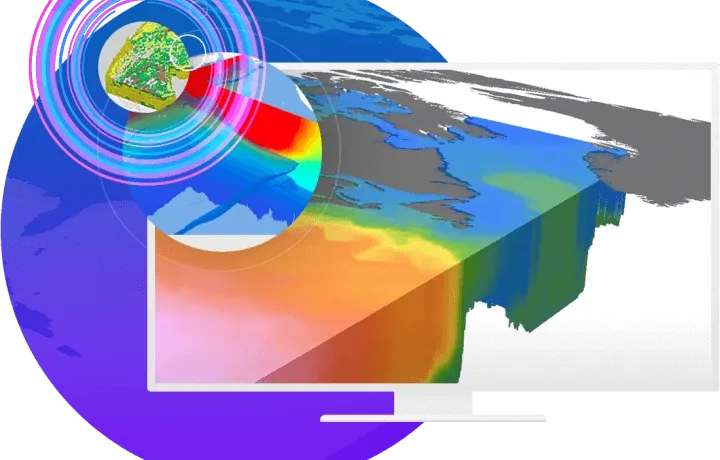
Voxel layers
Voxel functionality allows you to visualise 3D data grids with billions of voxel cubes while leveraging data filtering, symbology control customised for 3D data visualisation, time animations, and other interactive exploration features. From visualising climate change modalities, marine ecosystems, geological phenomena to creating a time-series of the digital divide and environmental and social justice metrics, this format of visualisation can help convey critical information.
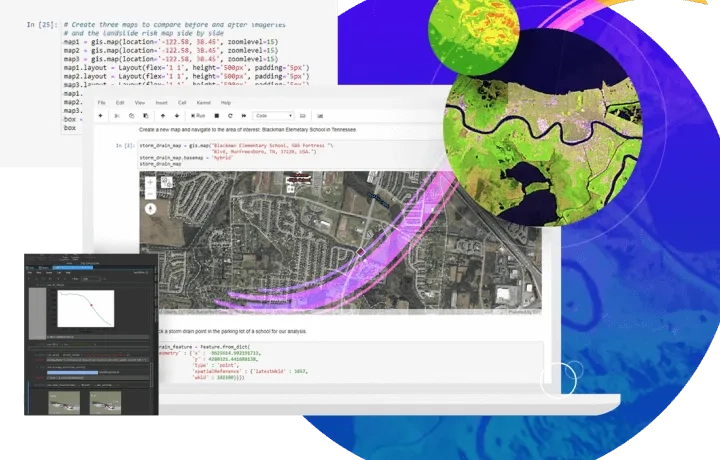
Python Notebooks
ArcGIS Notebooks, Esri's spatially optimised Jupyter environment, is integrated and easily accessible within ArcGIS Pro. It's a great workspace option for users who want to learn and practice with Python, do data engineering and transformation, perform statistical modelling, and develop machine learning and deep learning apps. ArcGIS Notebooks allows users to create, edit, and save notebooks as part of an ArcGIS Pro project rather than having part of an analysis within ArcGIS Pro and another part of it in a separate Jupyter environment. Users can also work seamlessly in notebooks and the ArcGIS Pro user interface by moving data and results back and forth between the two.
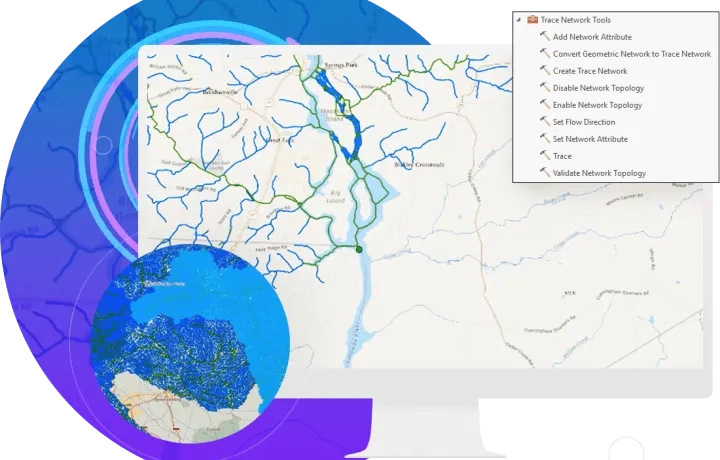
Trace network
Trace network is the main component users work with to visualise, manage, and analyse simple connectivity models, such as rail and hydro, in ArcGIS Pro. The trace network uses a set of connected edges, junctions, or both in conjunction with network attributes (also known as network weights) to model the flow of resources through the network.
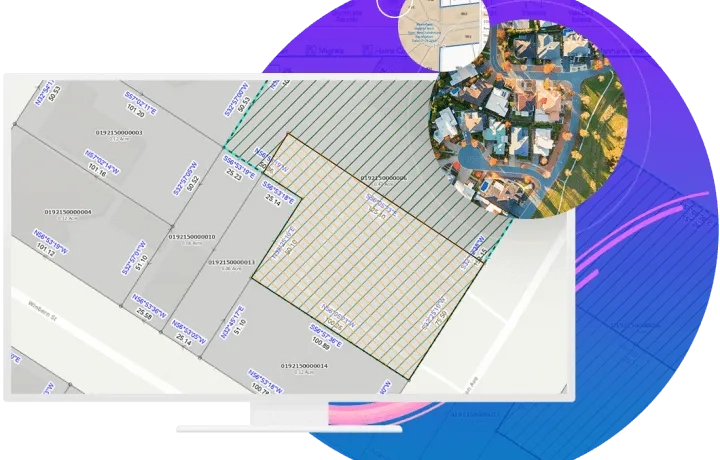
Parcel fabric
The parcel fabric provides a comprehensive framework for managing, editing, and sharing 2D and 3D parcel data in ArcGIS Pro. Work with 4D parcel data in a multiuser environment, and the parcel fabric can be edited and maintained using a services-based architecture. A services-based architecture allows you to share the parcel fabric across all platforms (desktop, mobile, and web), and different workflows can be enabled for different clients in the field and in the office.